XNAT user documentation
Tagging your scans
For AnatQC to discover T1w and vNav scans to process, you need to add notes to those scans in XNAT. You can add notes using the Edit button located within the Actions box on the MR Session report page
Type |
Example series |
Note |
|---|---|---|
|
|
|
|
|
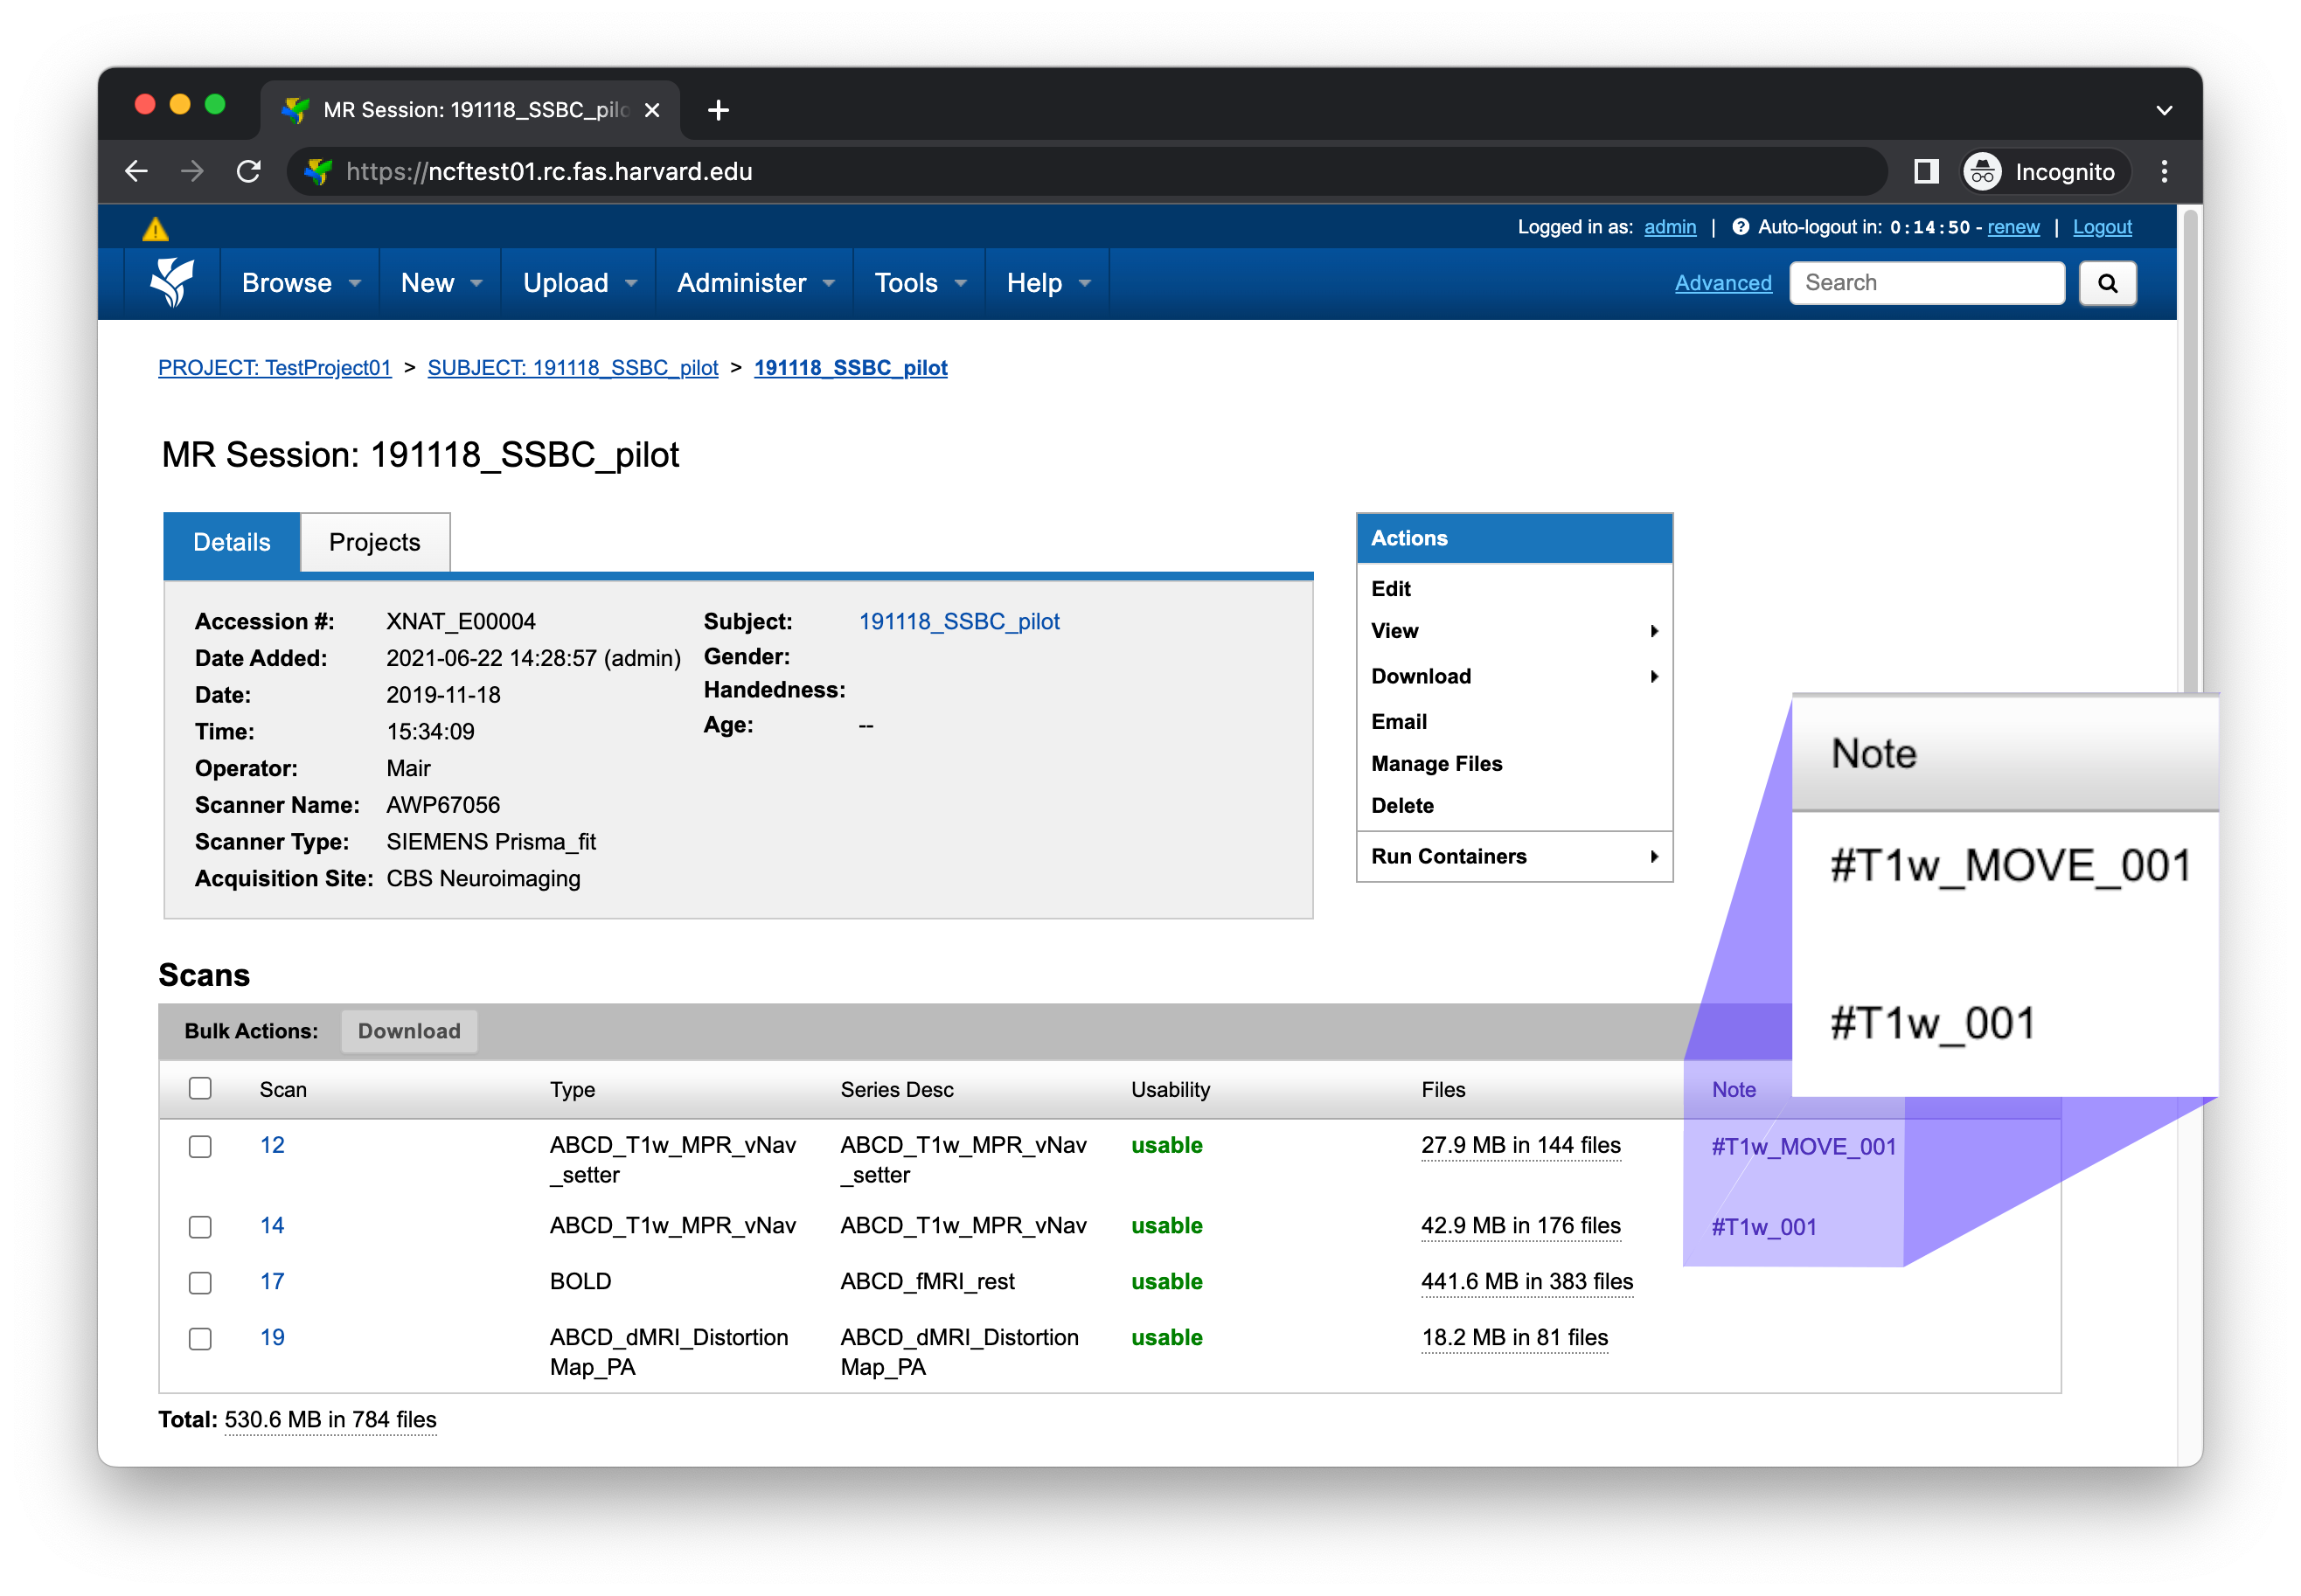
The image below displays an MR Session report page with populated notes
Note
Note that if a T1w scan has a corresponding vNav scan, they should be assigned matching numbers. For example, #T1w_move_001 would correspond to #T1w_001.
Running the pipeline
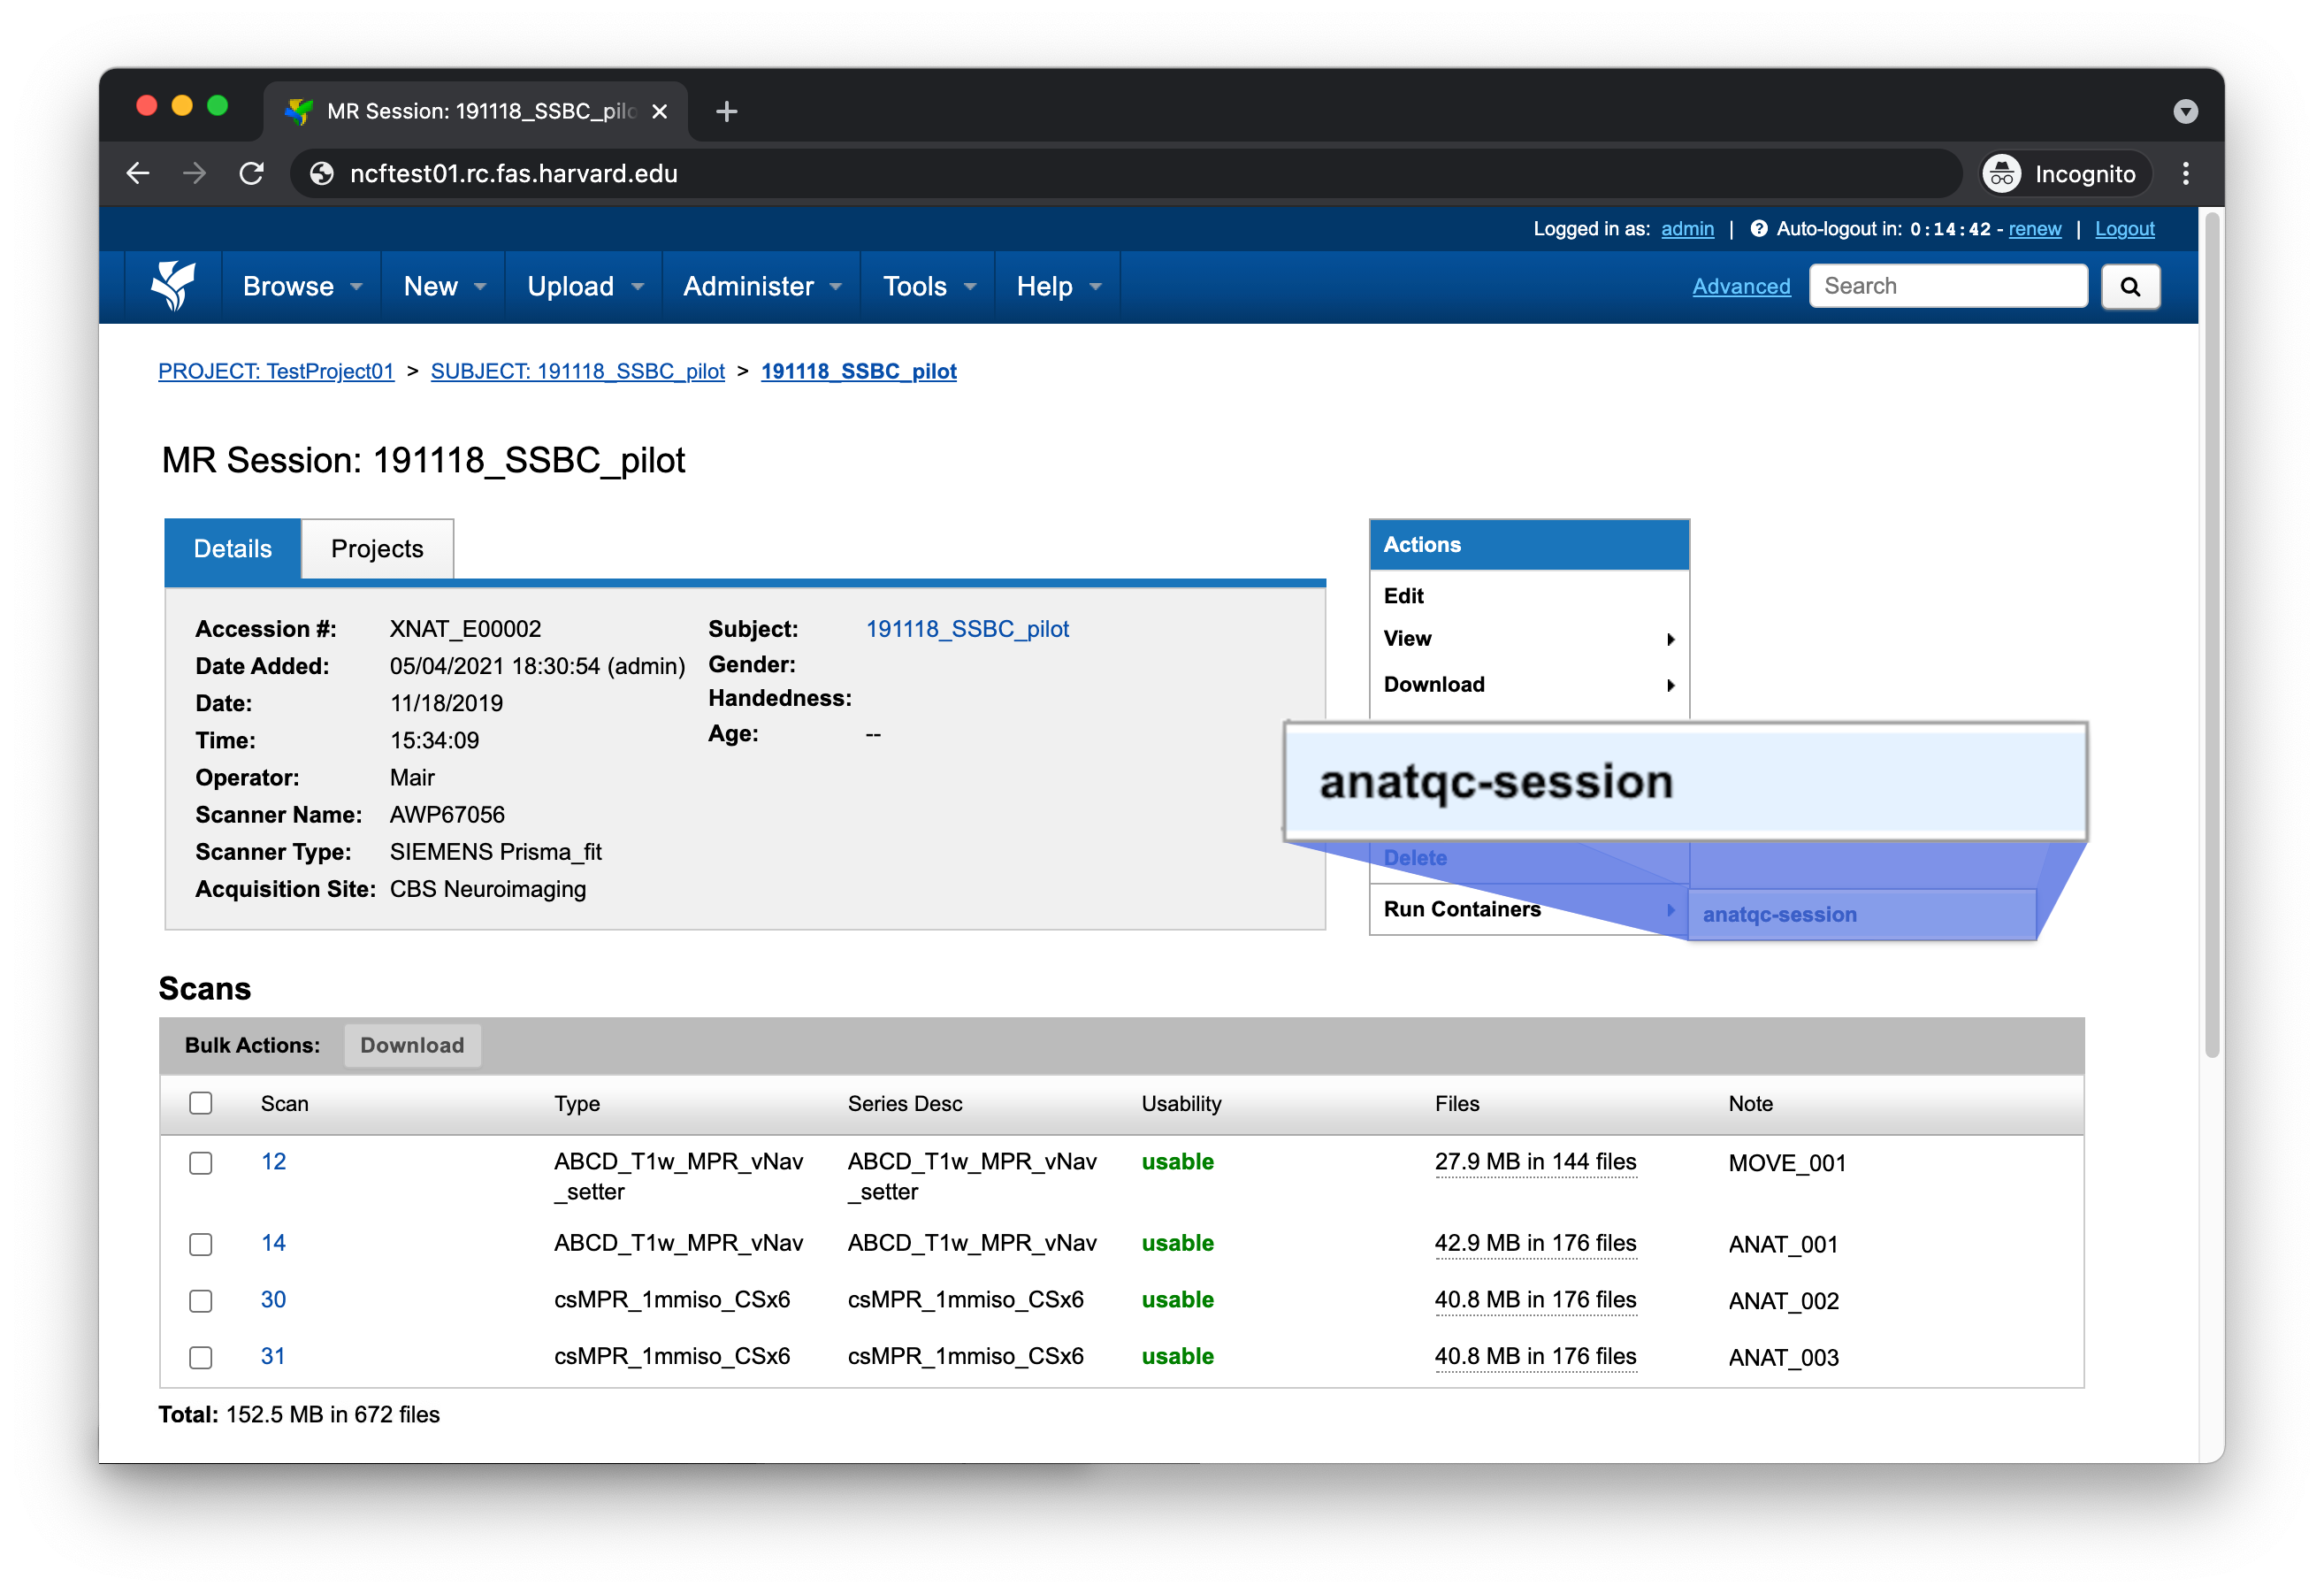
To run the AnatQC pipeline, use the Run Containers > anatqc-session button located within the Actions box on the MR Session report page
Note
If you don’t see the Run Containers menu, please refer to Setting up the container.
This should bring up a small form with several configurable settings. Continue reading for a description of each setting
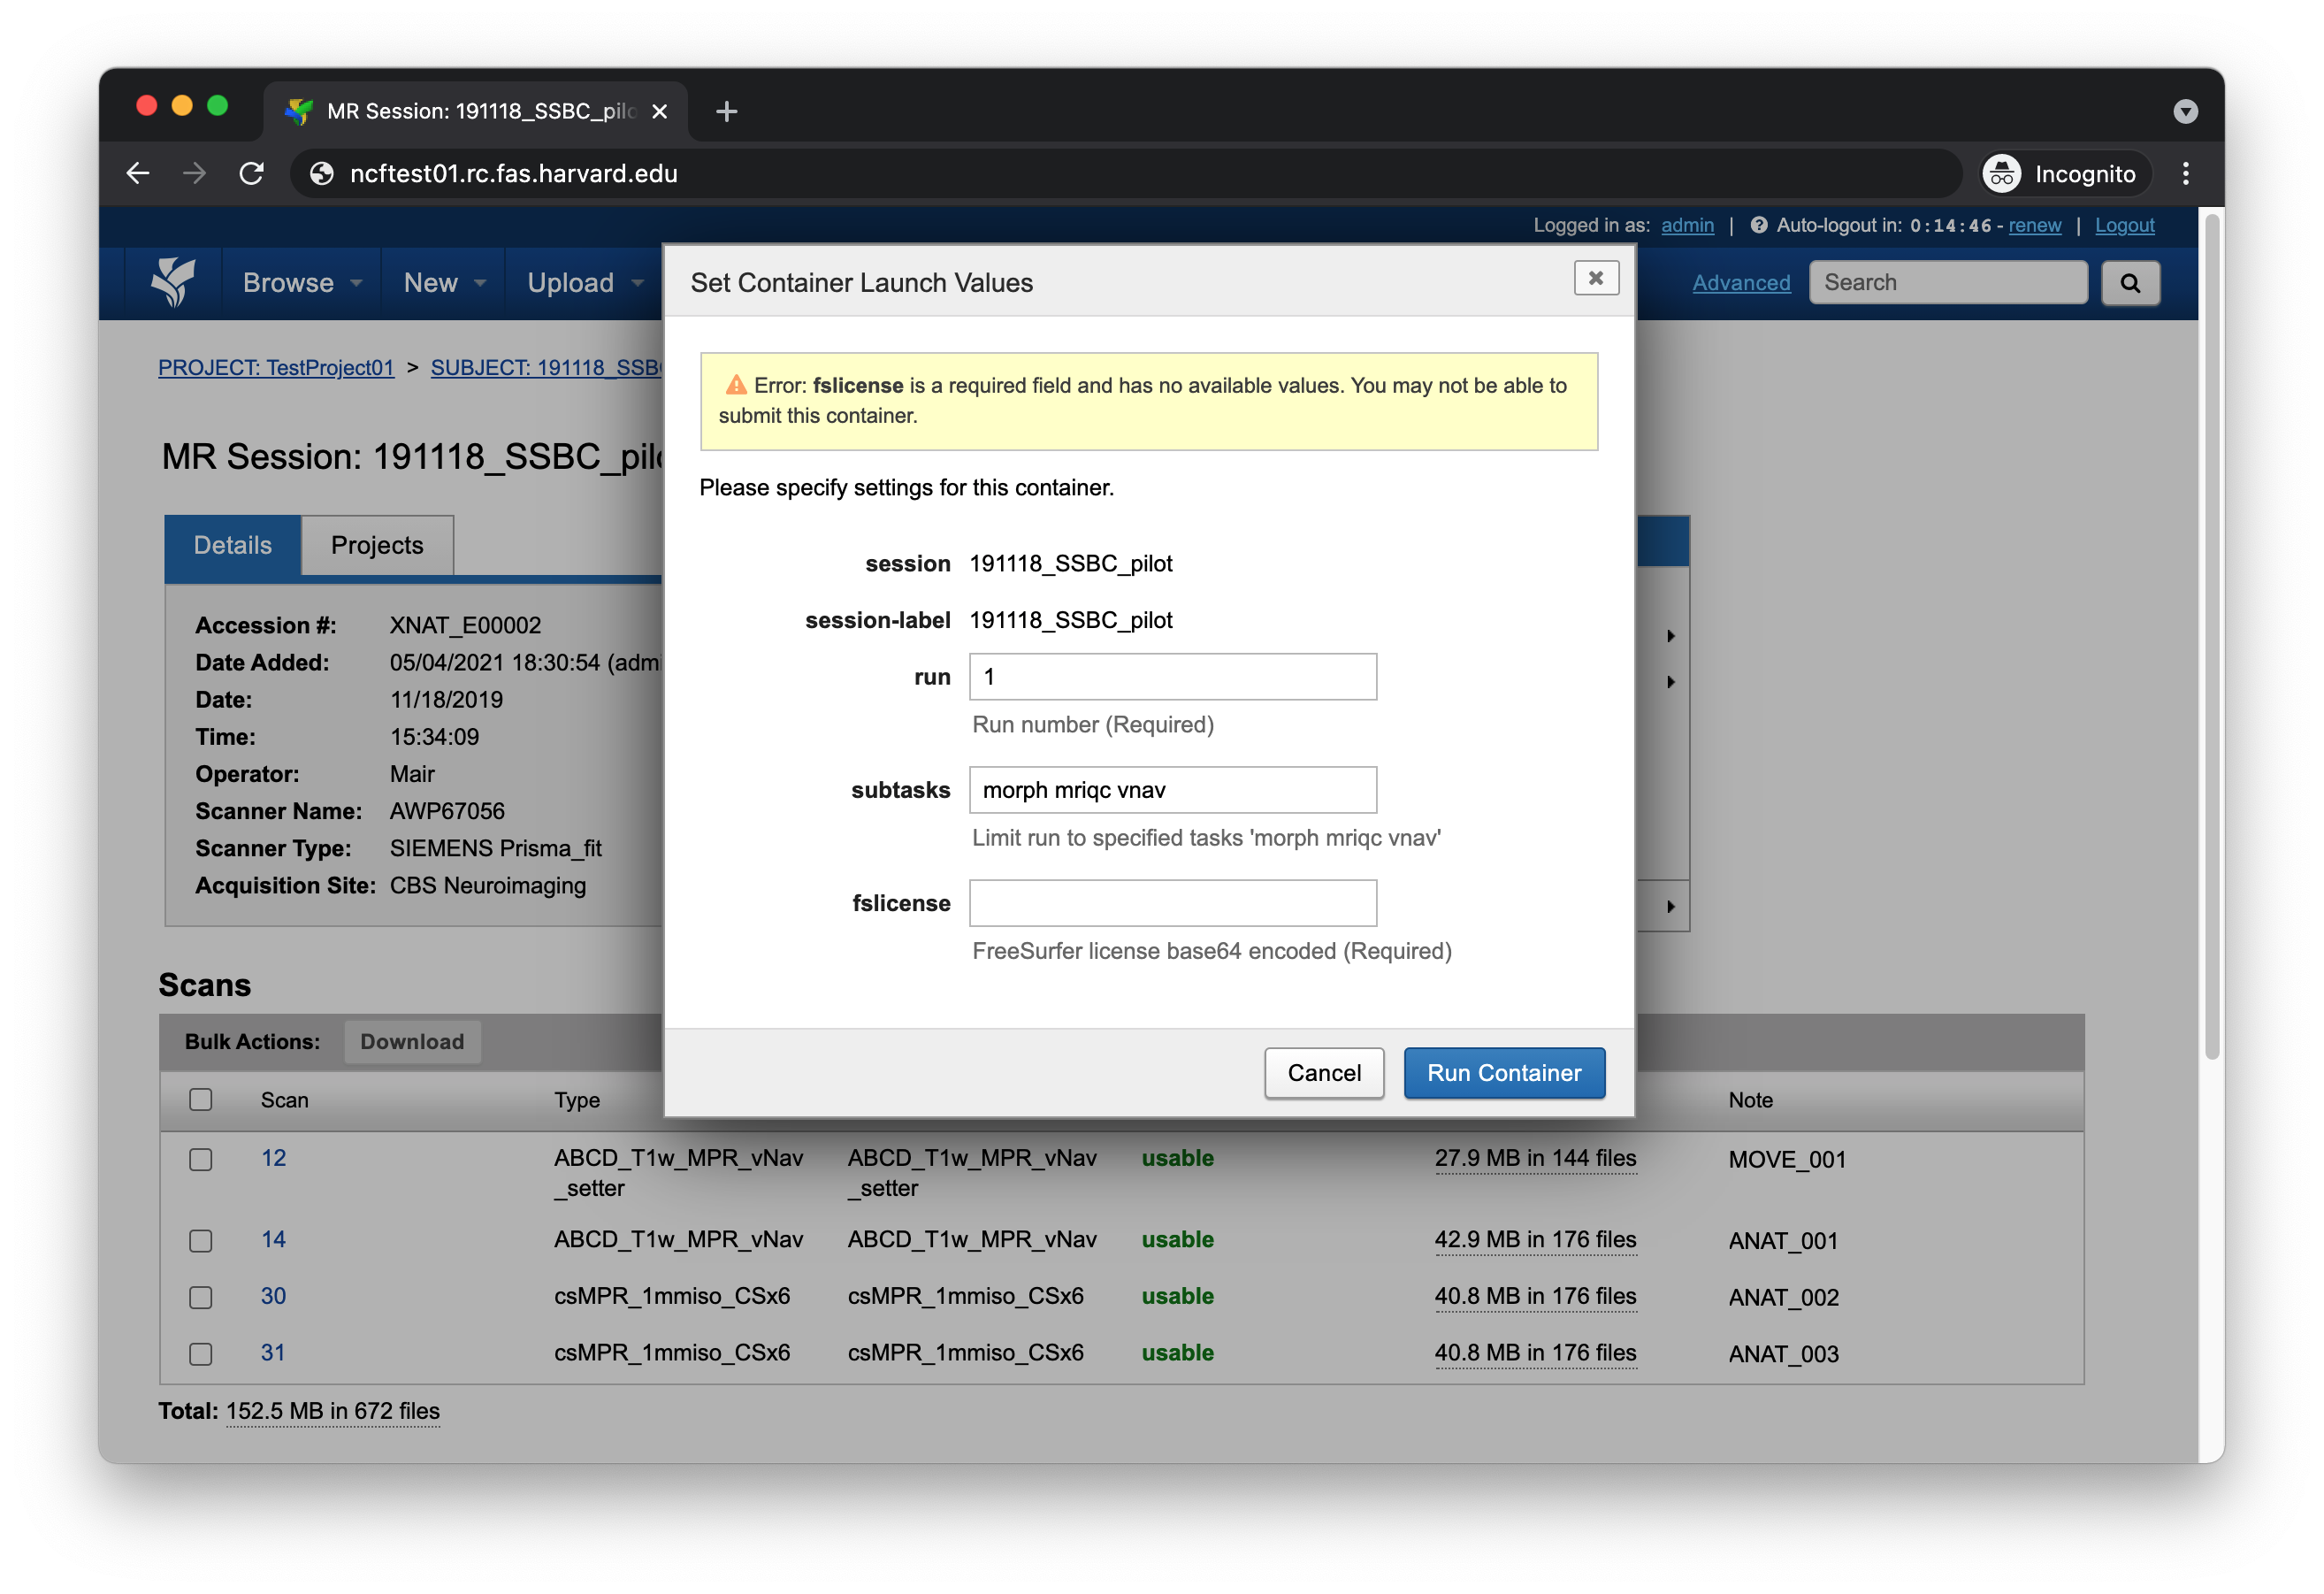
run
This should be set to the integer value of the scan you want to process. If there’s a corresponding move scan, that scan will also be processed
T1w scan |
run |
|---|---|
|
1 |
|
2 |
|
999 |
subtasks
Under most circumstances you’ll want to leave this field set to its default value
morph mriqc vnav
fslicense
This field should be set to a base64 encoded FreeSurfer license. If you have a license file on a Linux or macOS machine, you can use the openssl command
openssl base64 < license.txt
or you can use the base64 command, if that utility is installed
base64 license.txt
Understanding the report page
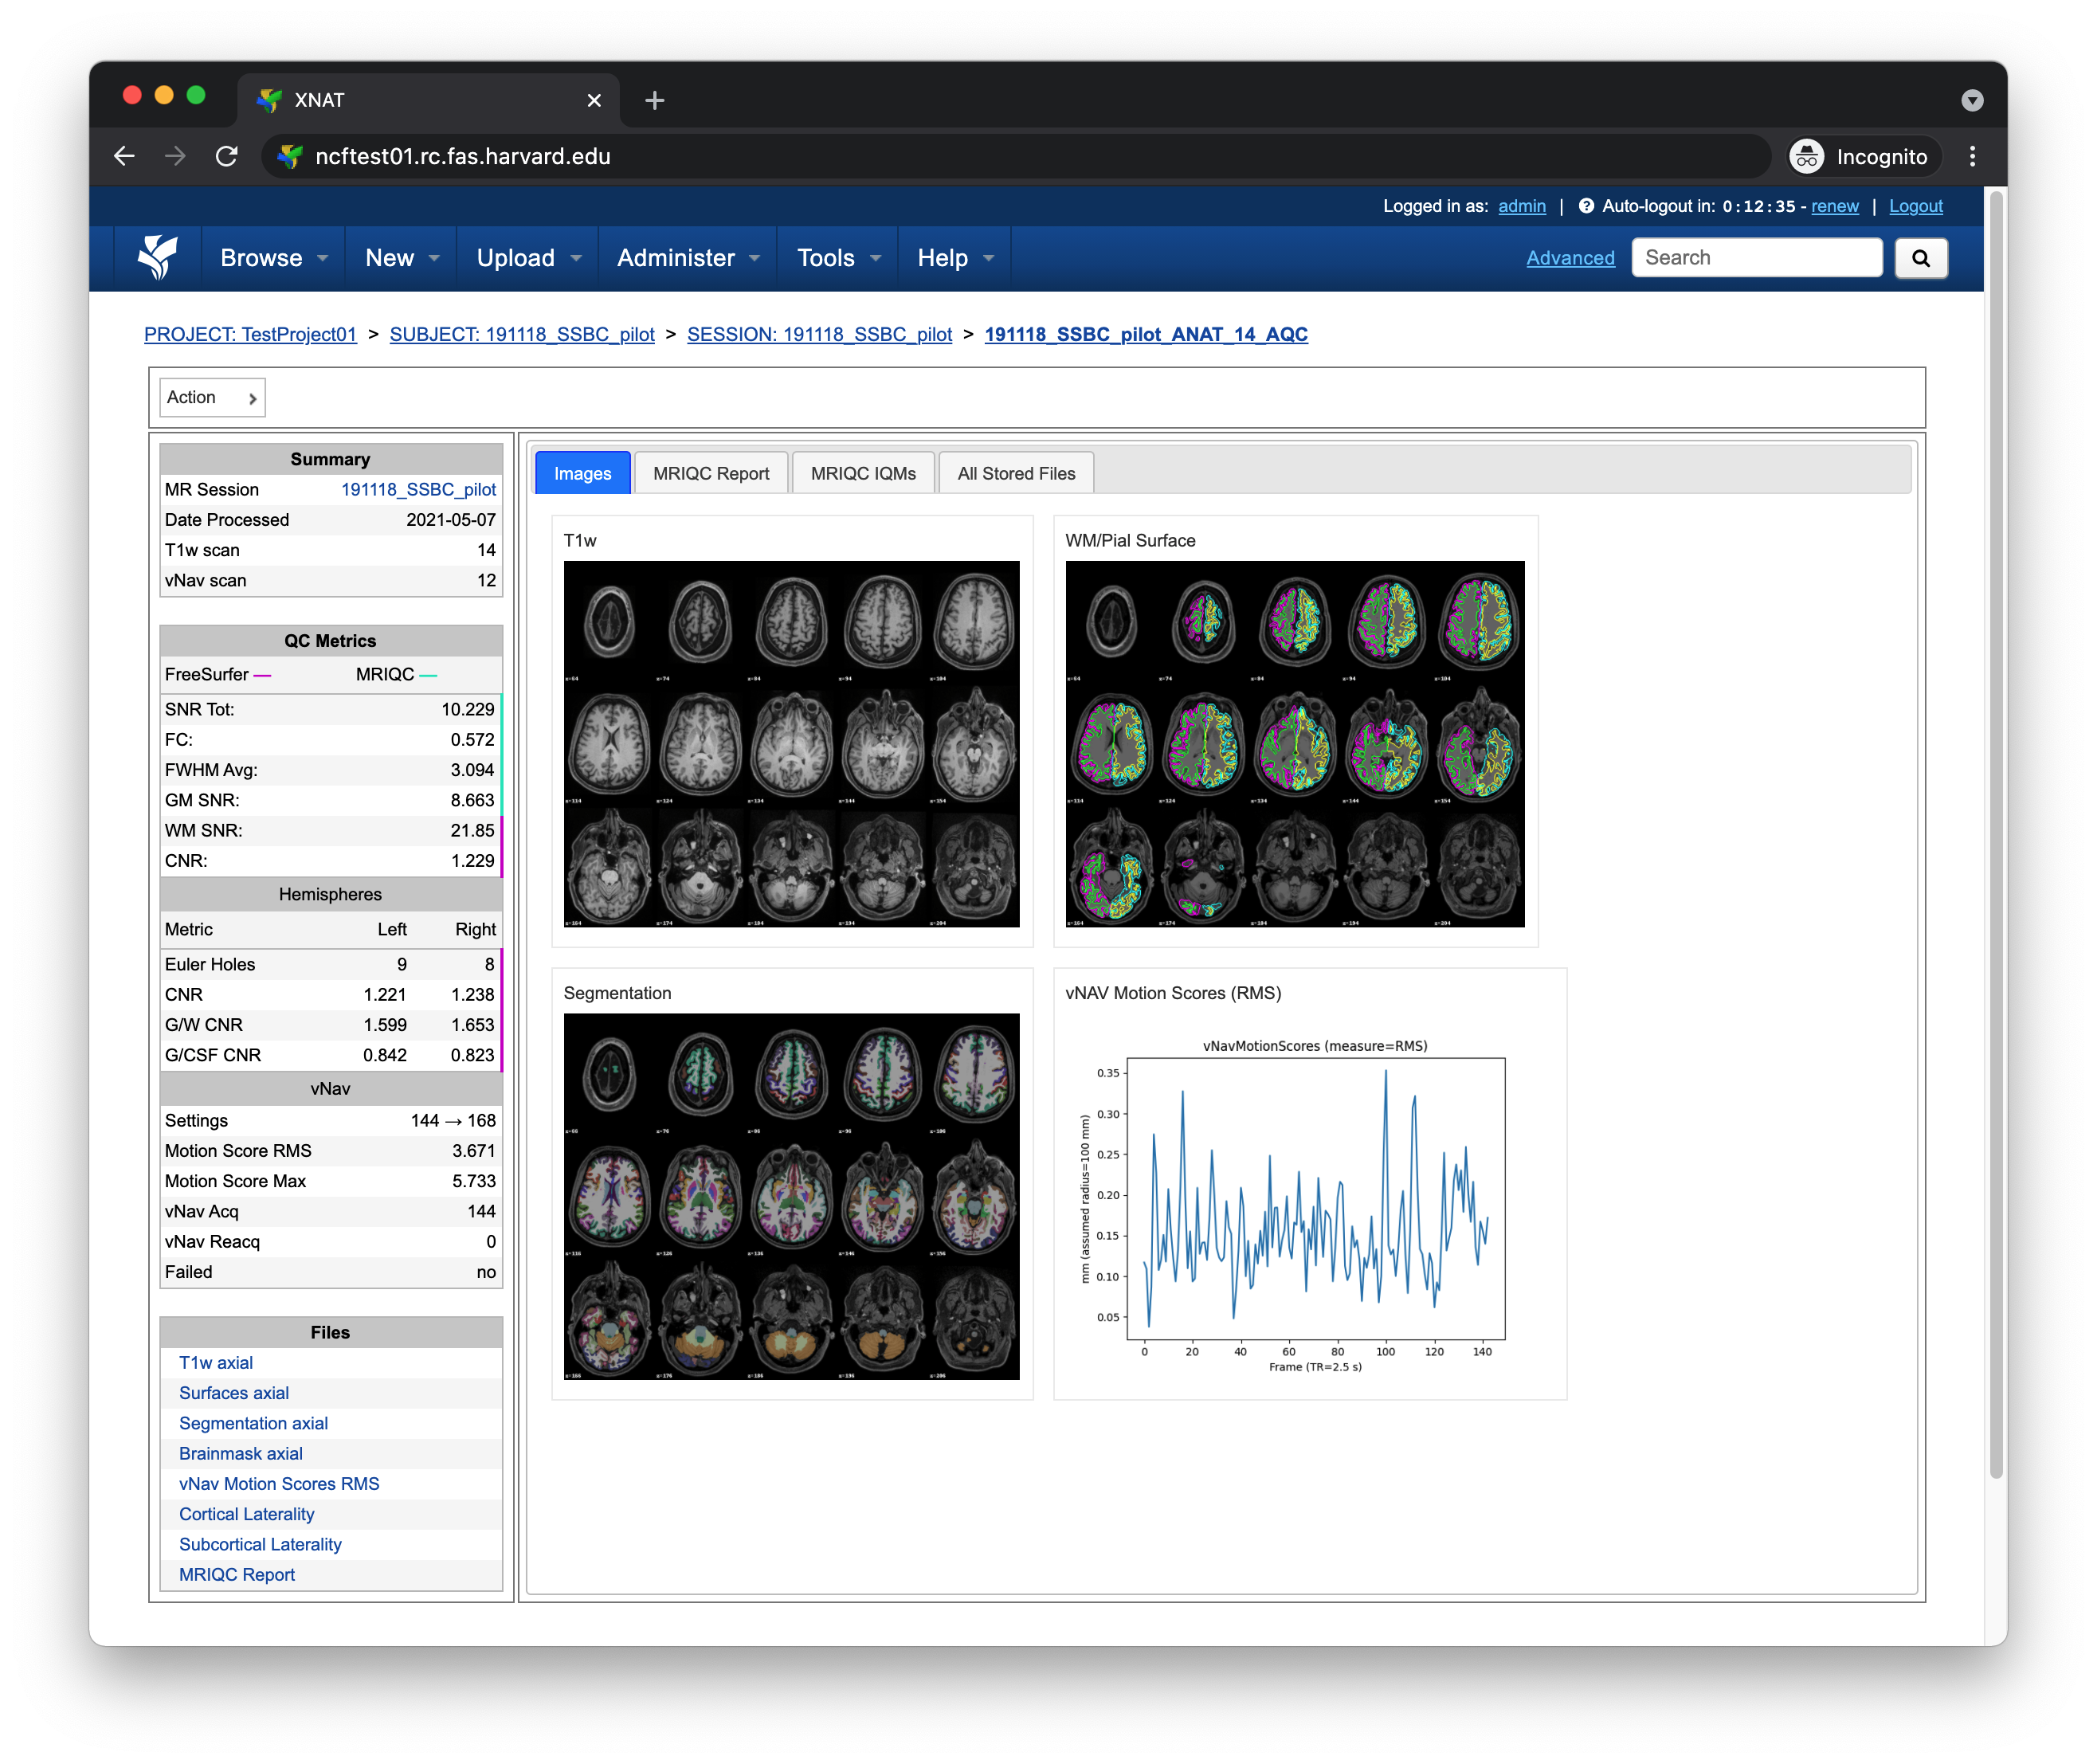
The following section will break down each section of the AnatQC report page.
Left pane
The left pane is broken up into several distinct sections. Each section will be described below.
Summary
The Summary pane orients the user to what MR Session they’re currently looking at and various processing details
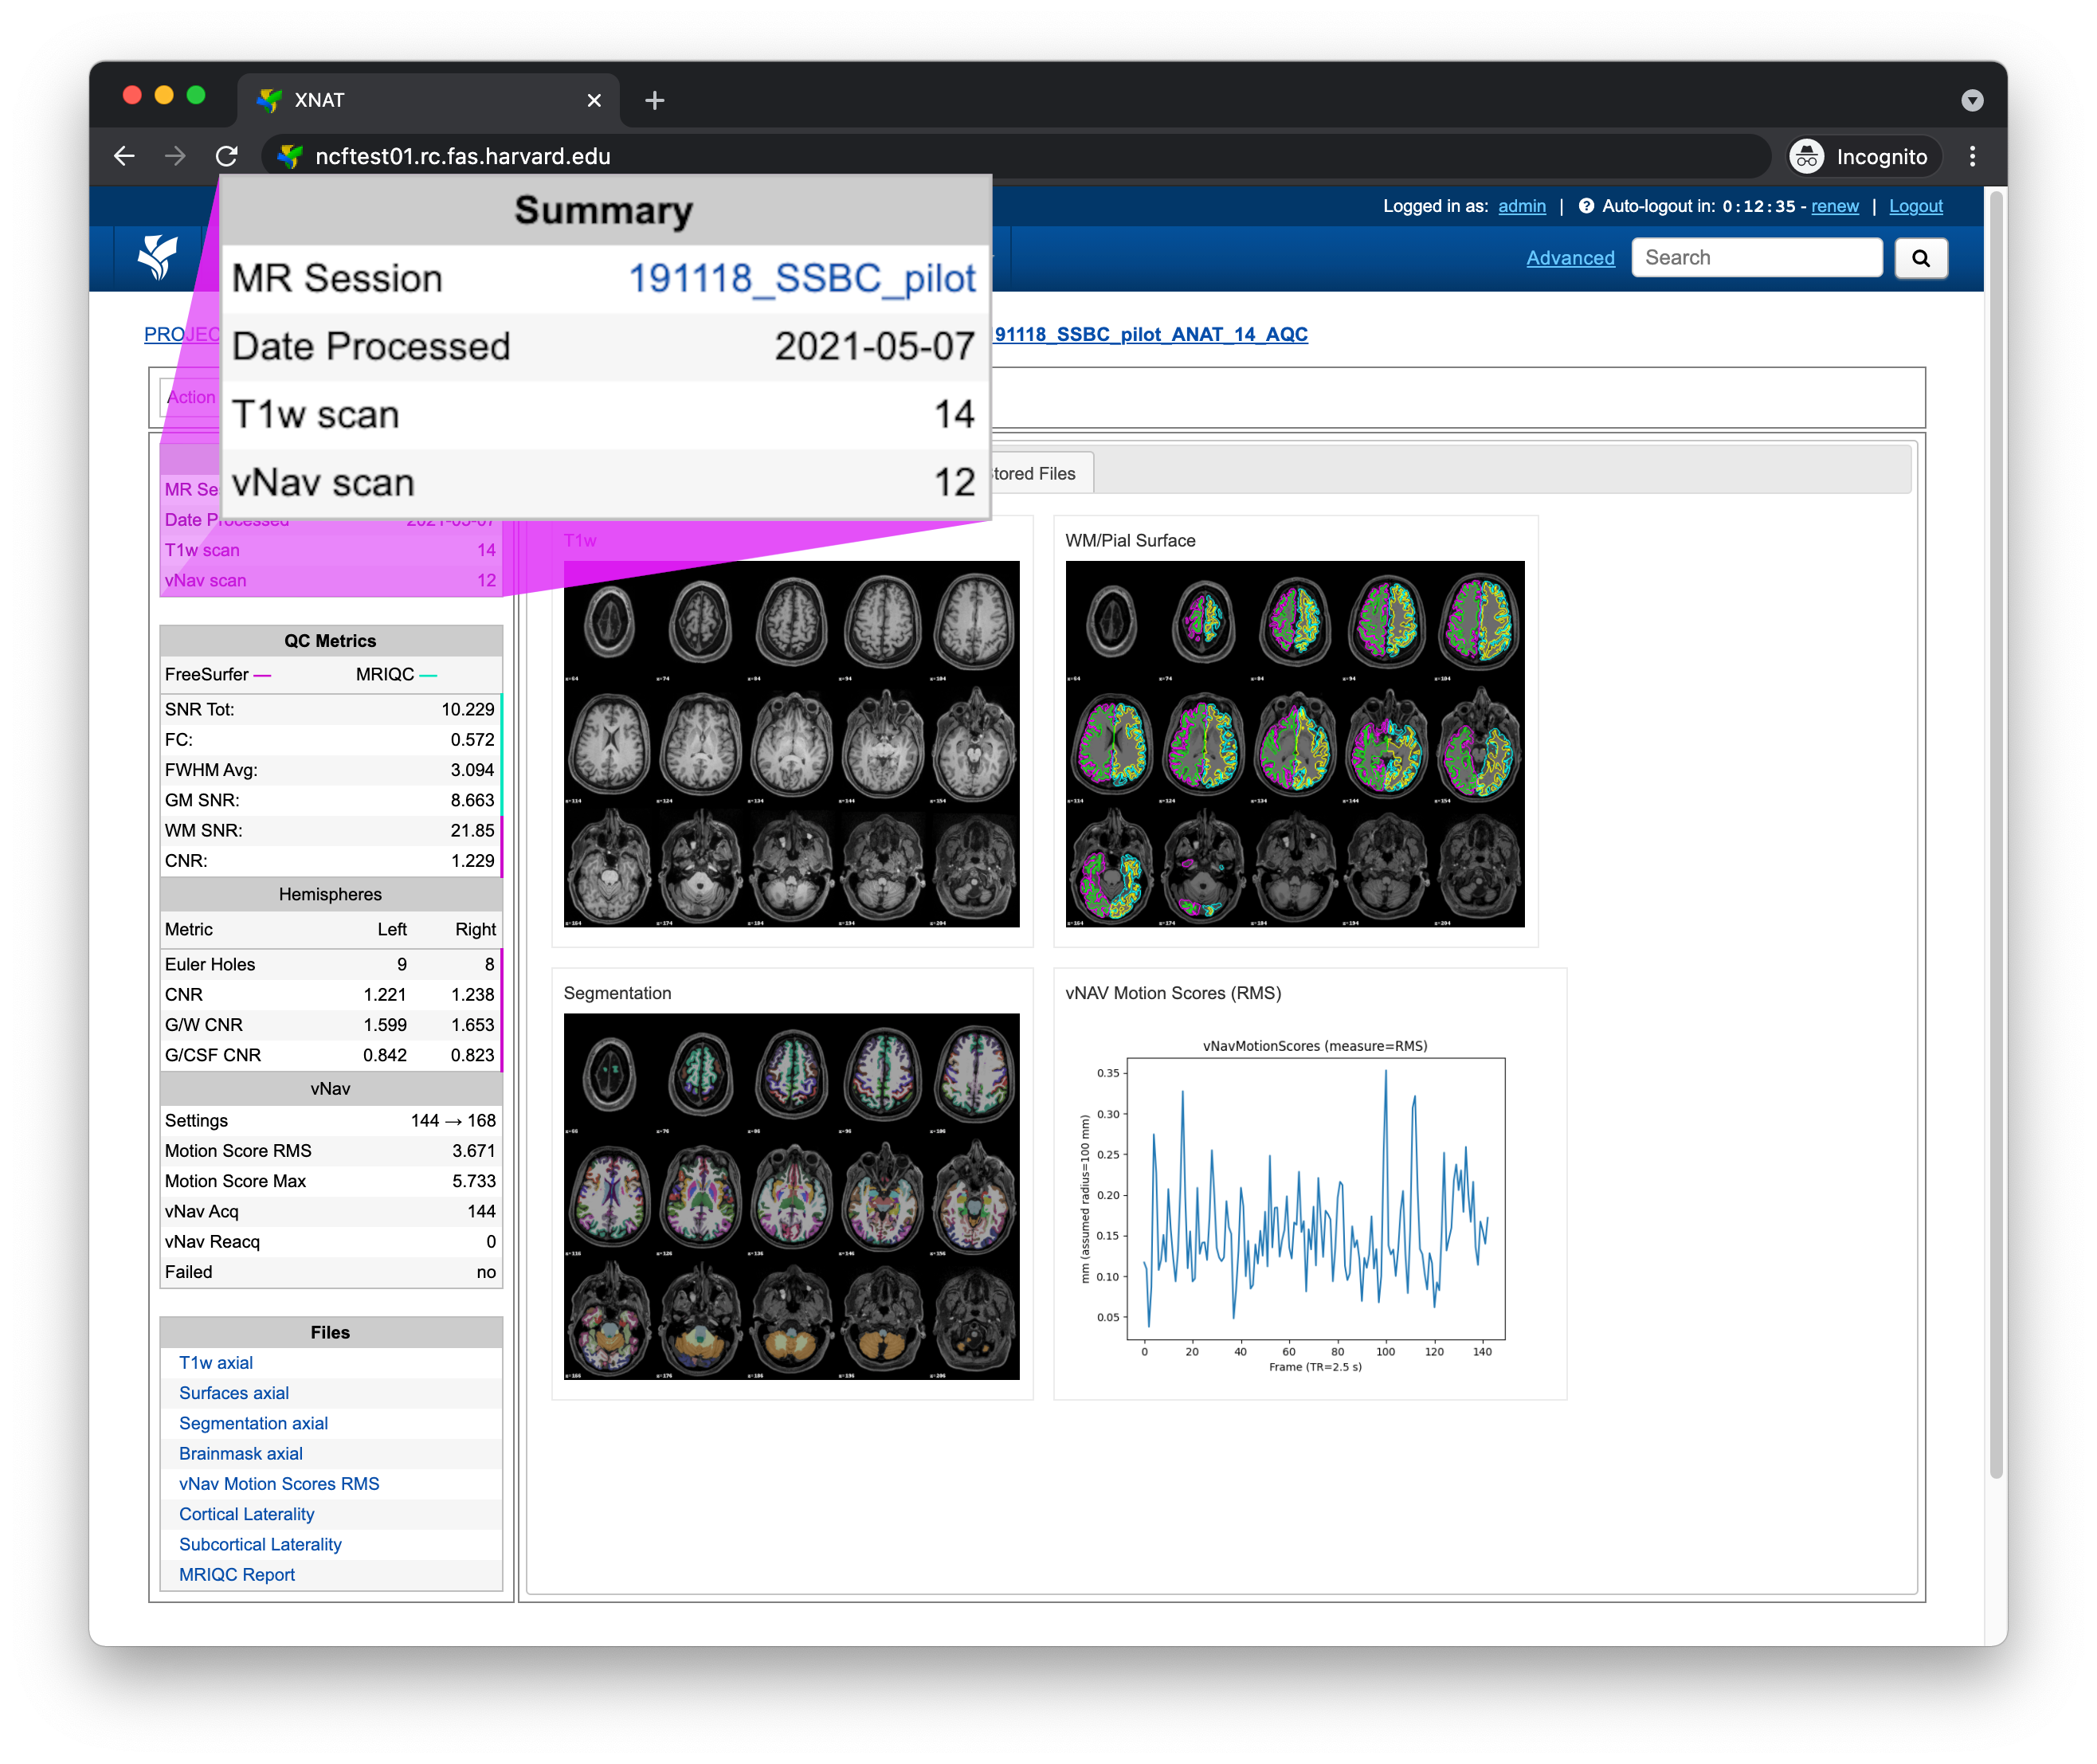
Key |
Description |
|---|---|
MR Session |
MR Session label |
Date Processed |
Processing date |
T1w scan |
T1-weighted scan used |
vNav scan |
vNav setter scan used (if present) |
QC Metrics
The QC Metrics pane displays quality control metrics computed over the entire volume
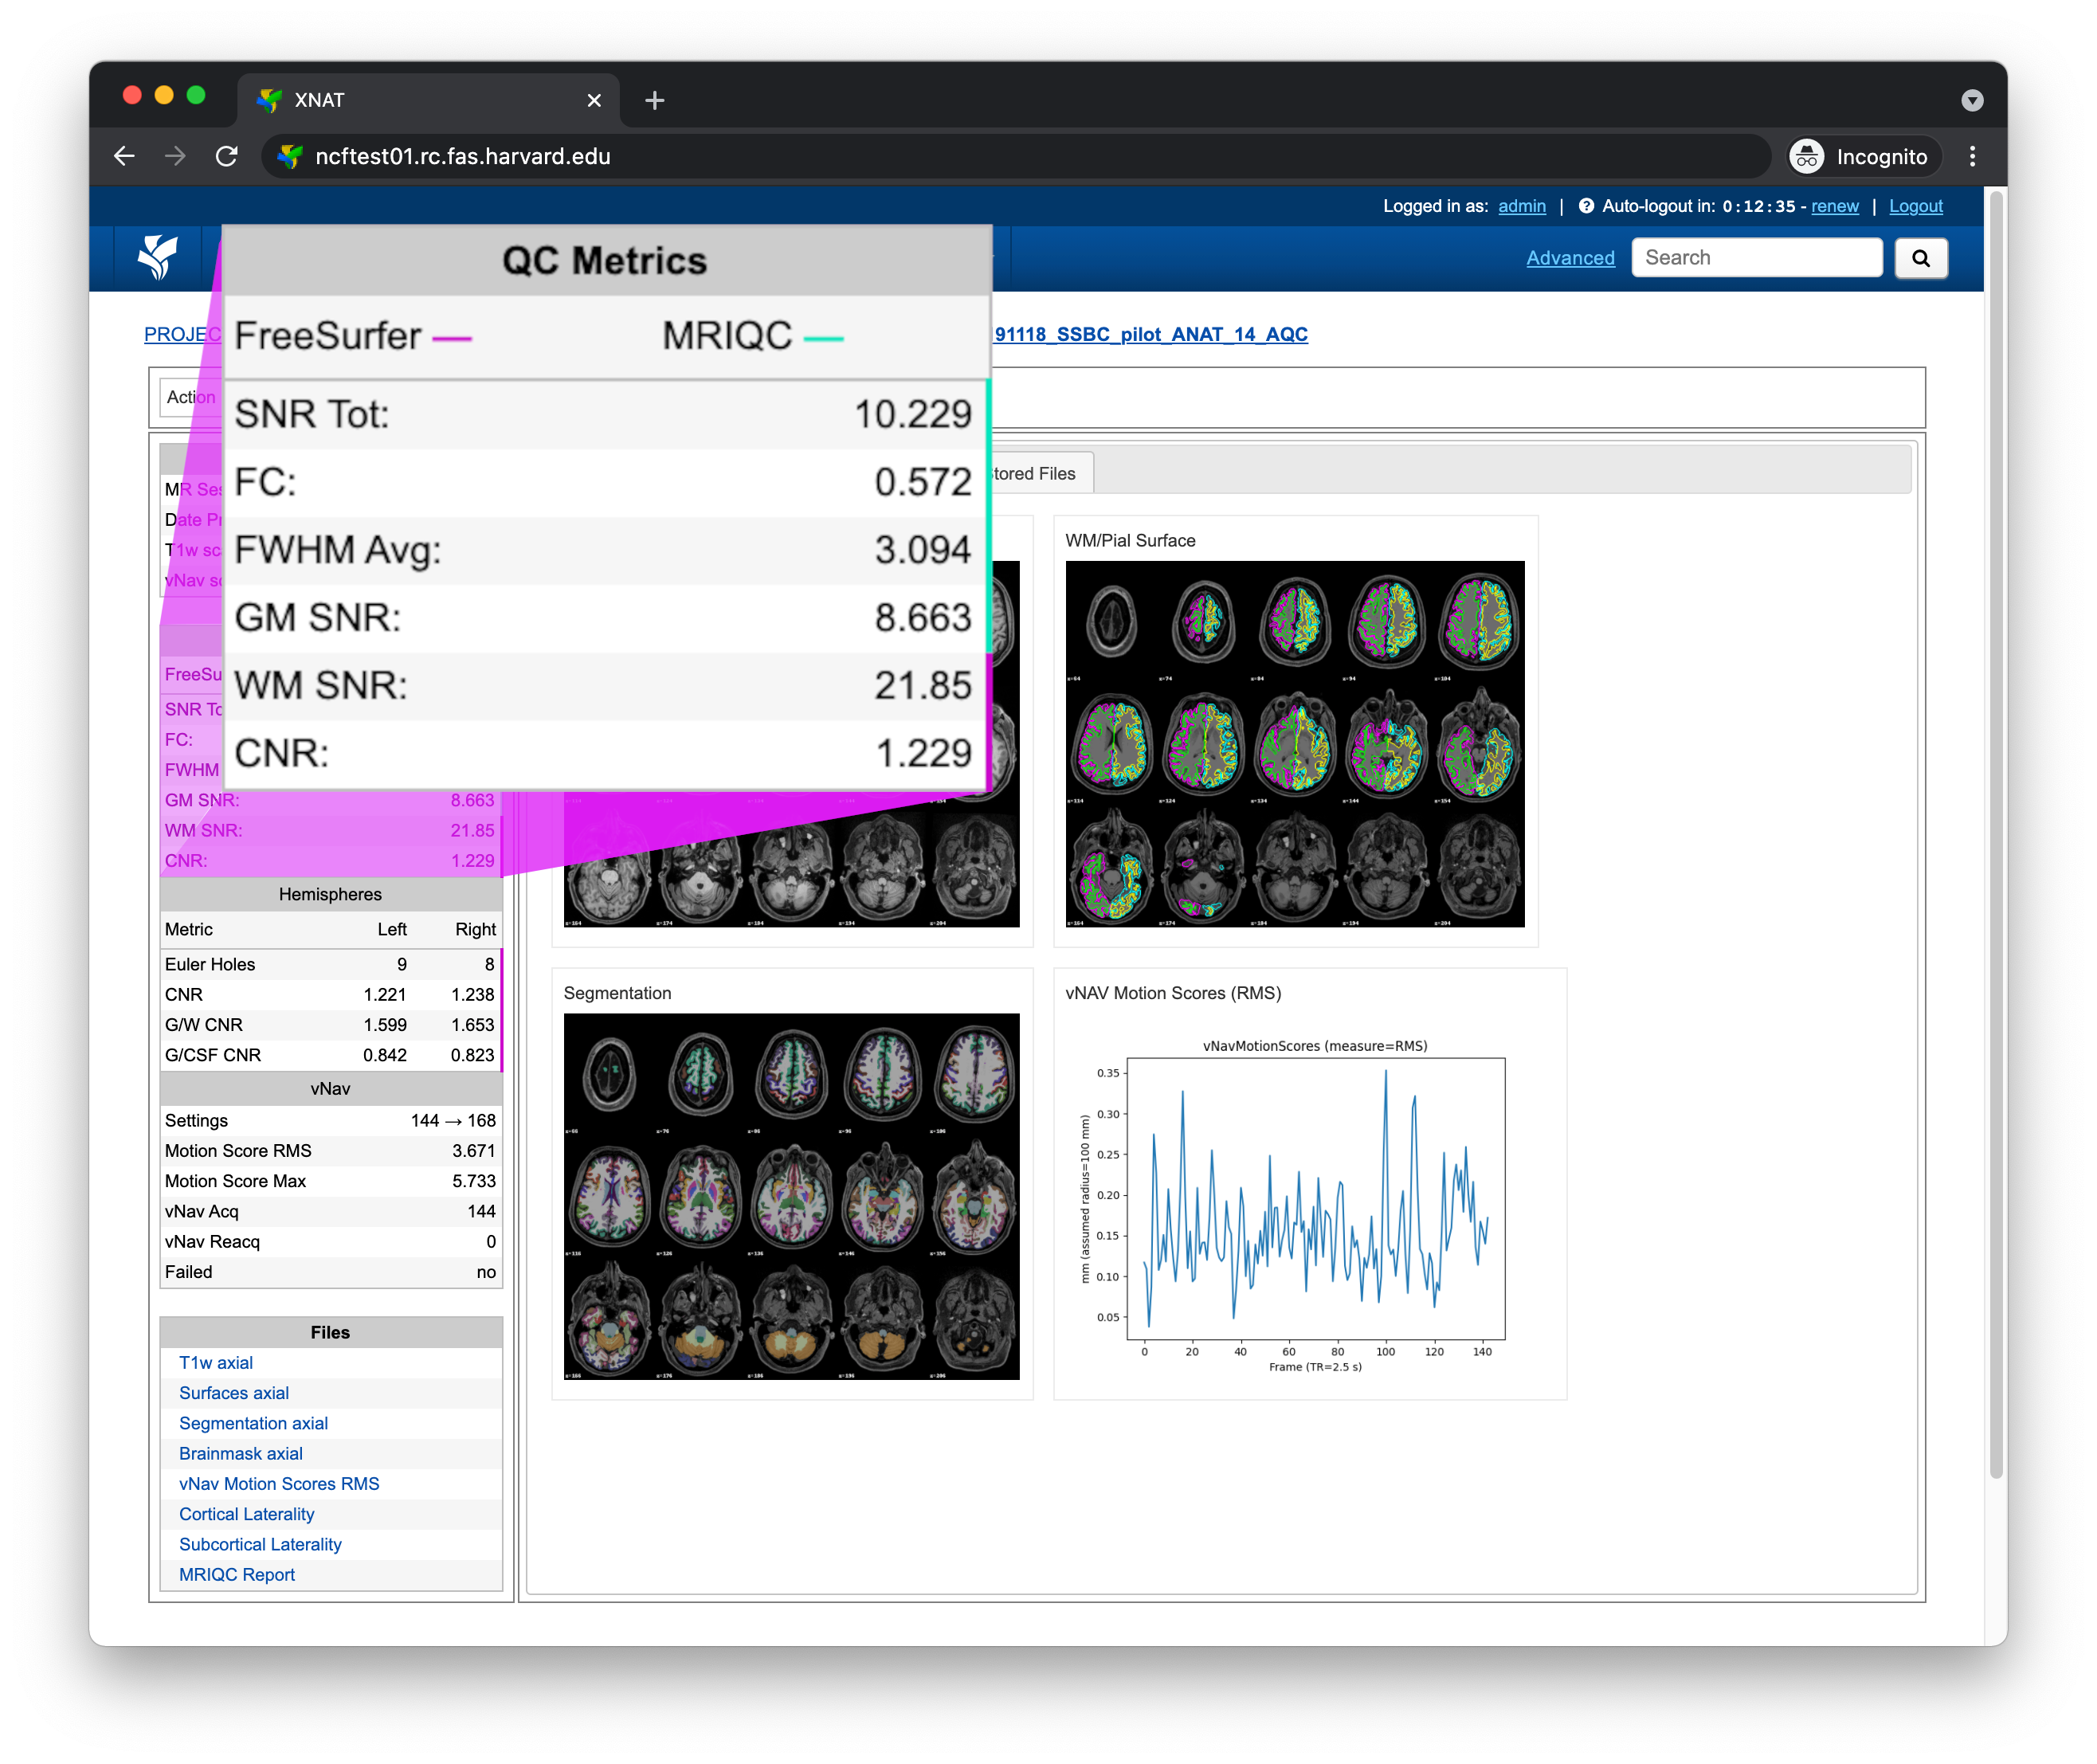
Metric |
From |
Description |
|---|---|---|
Signal-to-noise ratio |
||
FWHM of spatial distribution of voxel intensities |
||
Gray matter signal-to-noise ratio |
||
WM SNR |
White matter signal-to-noise ratio |
|
CNR |
Contrast-to-noise ratio |
Hemispheres
The Hemispheres pane displays quality control metrics computed over each hemisphere
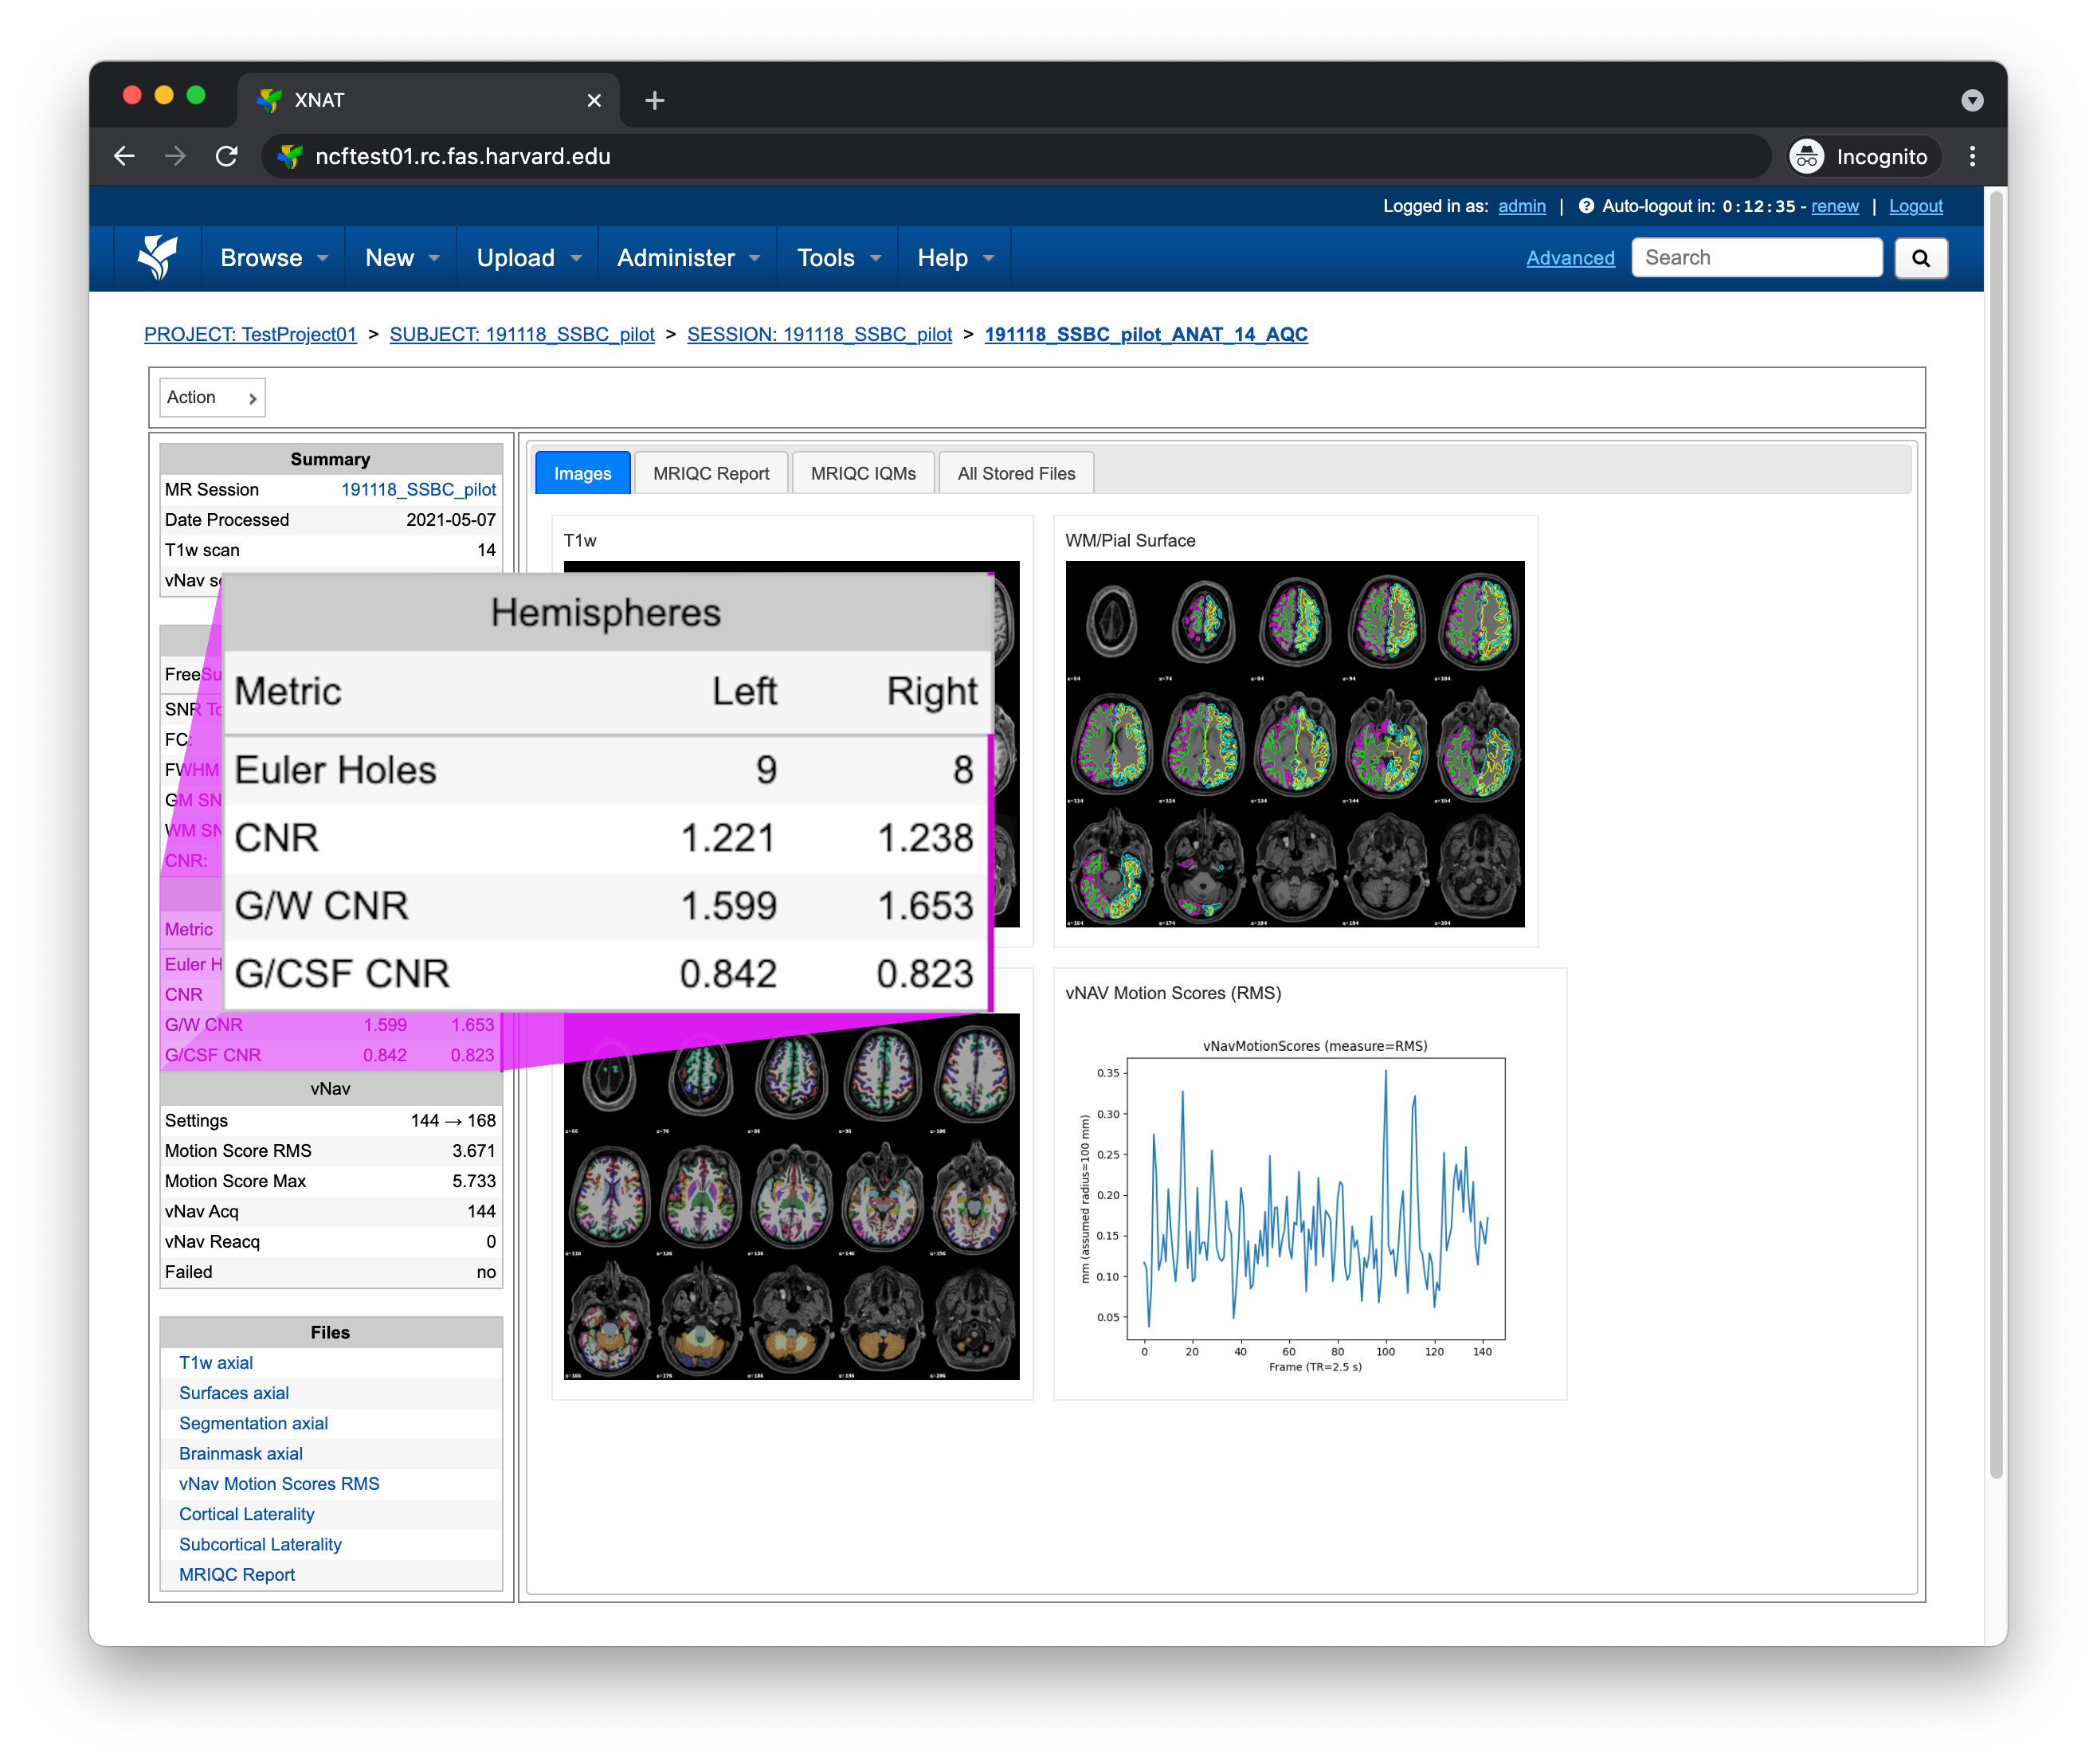
Metric |
From |
Description |
|---|---|---|
Estimate of the number of surface defects |
||
CNR |
Global contrast-to-noise ratio |
|
G/W CNR |
Gray and white matter contrast-to-noise ratio |
|
G/CSF CNR |
Gray matter and cerebrospinal fluid contrast-to-noise ratio |
vNav
The vNav pane displays vNav specific quality control metrics, but only if a vNav scan was processed
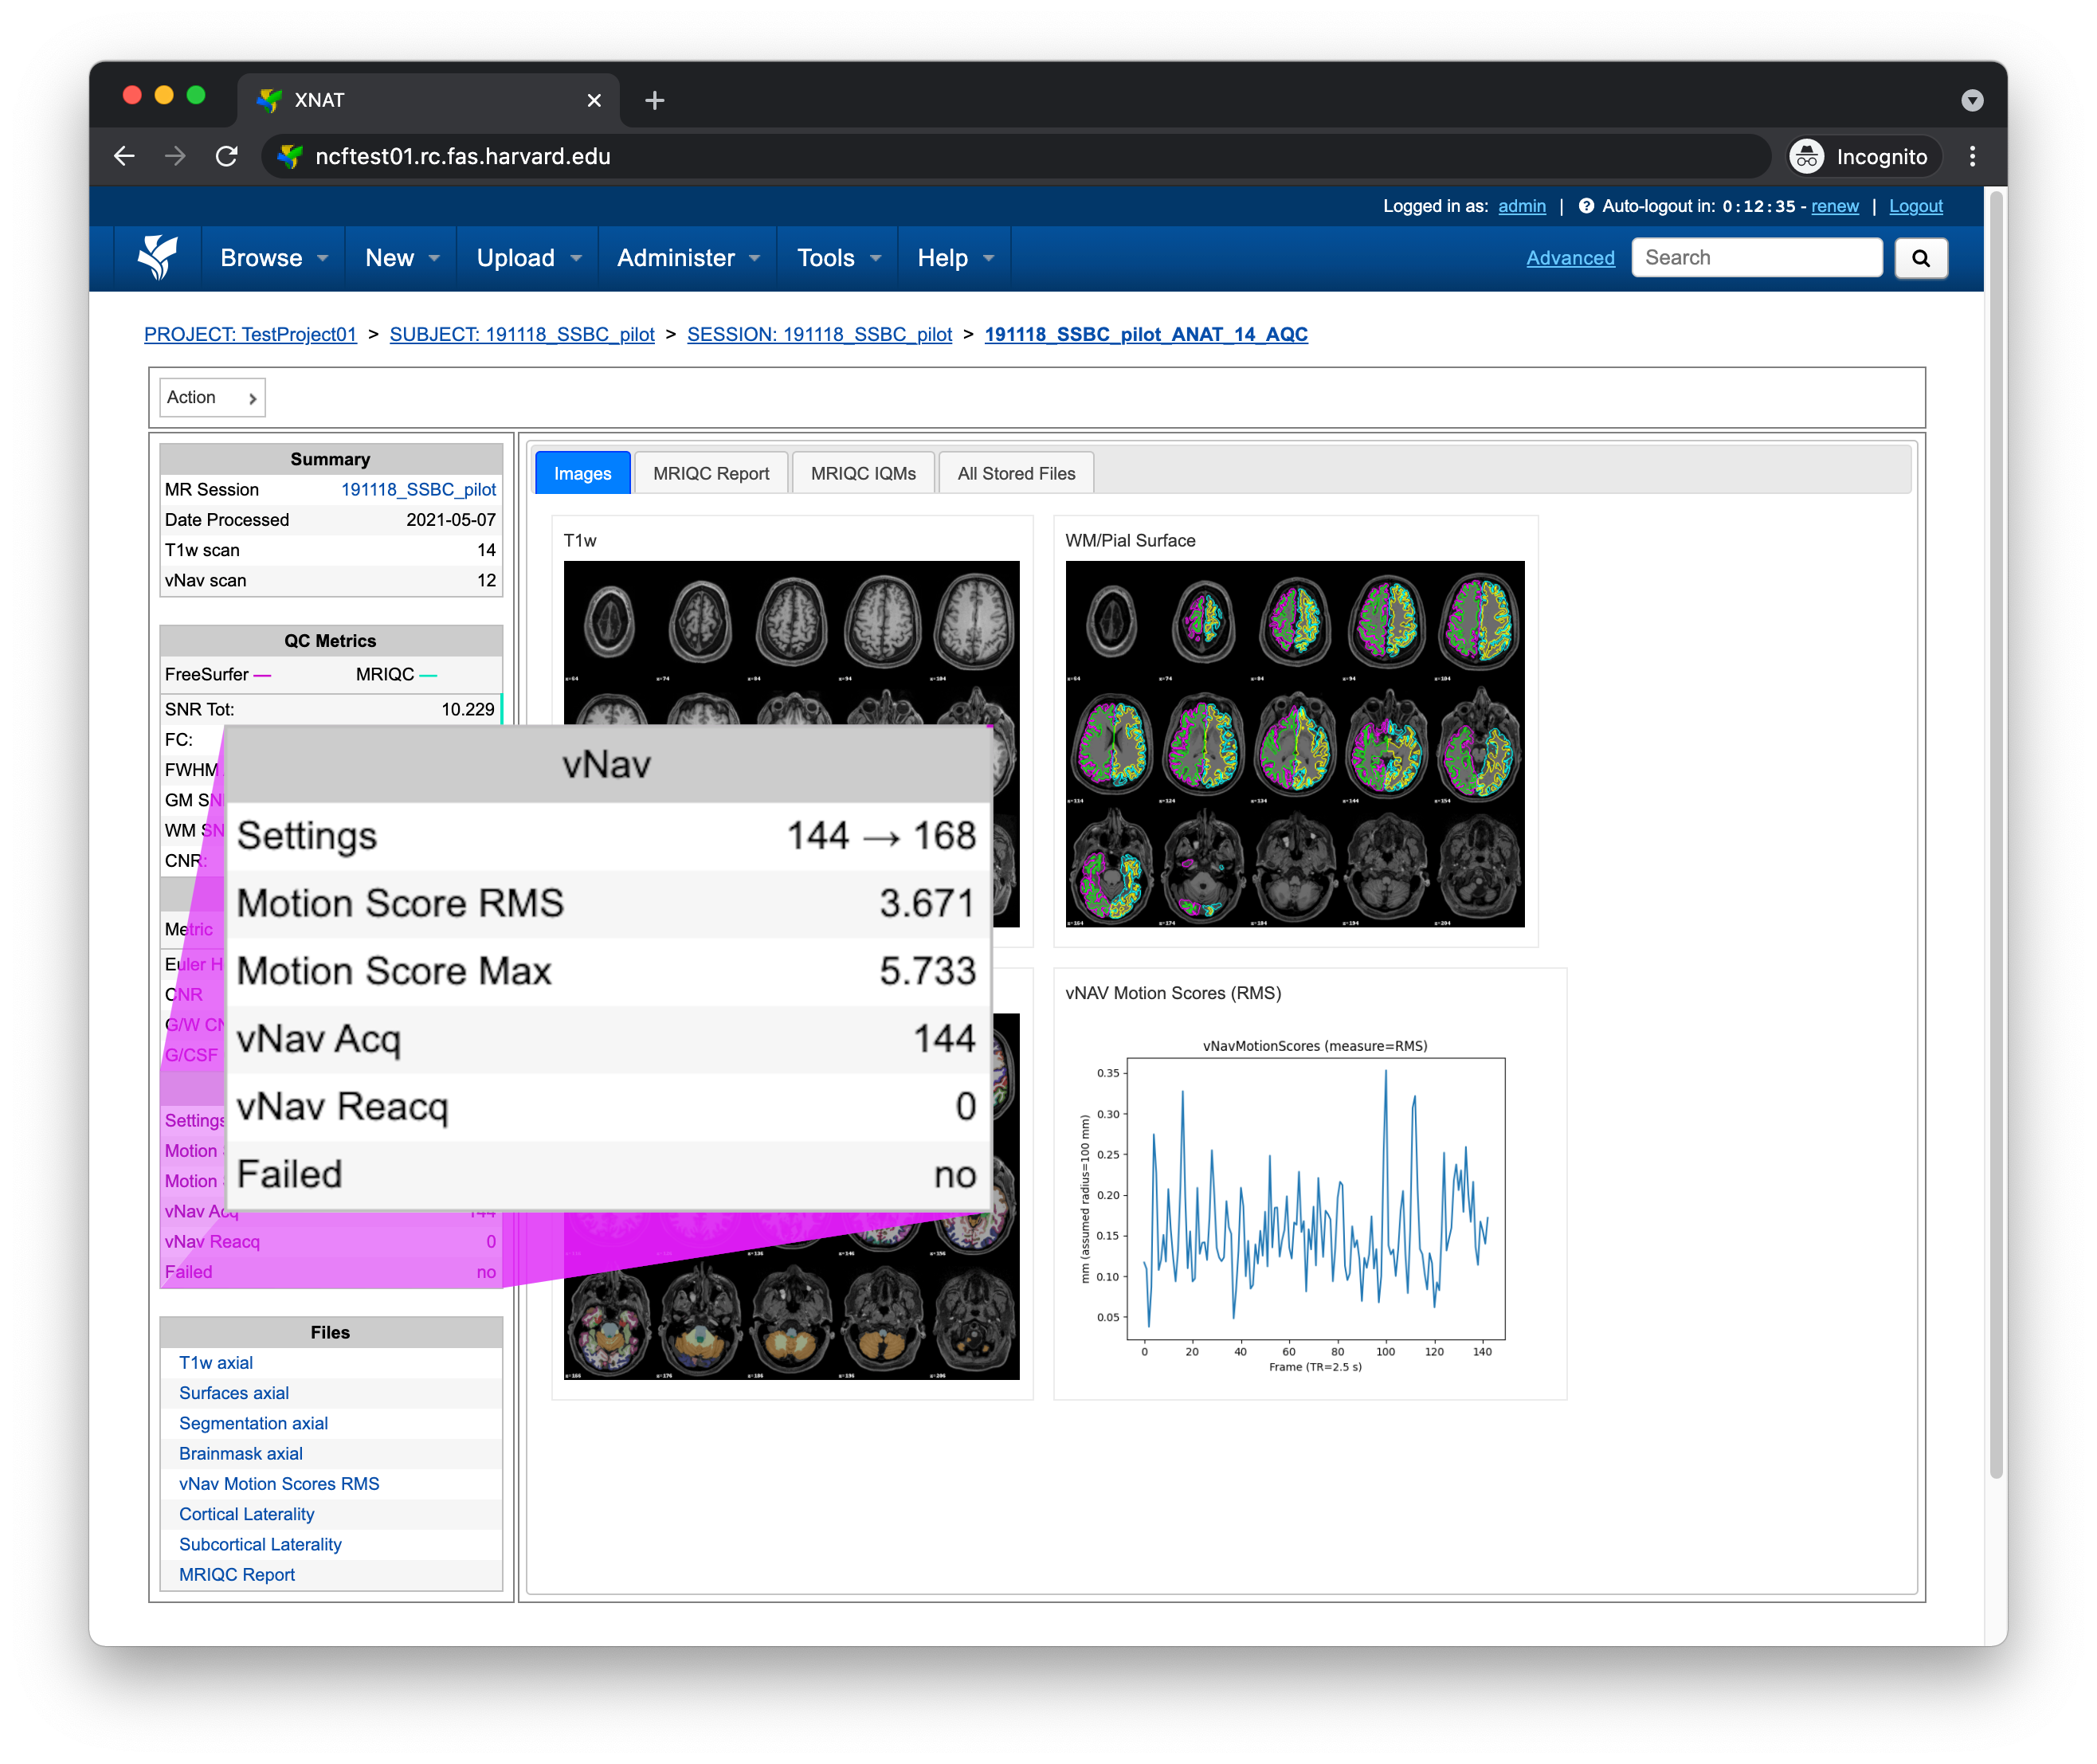
Metric |
Description |
|---|---|
Settings |
Minimum and maximum number of navigators allowed |
Motion Score RMS |
Root mean square of motion scores |
Motion Score Max |
Maximum motion score |
vNav Acq |
Total number of navigators collected |
Failed |
vNav failure detected |
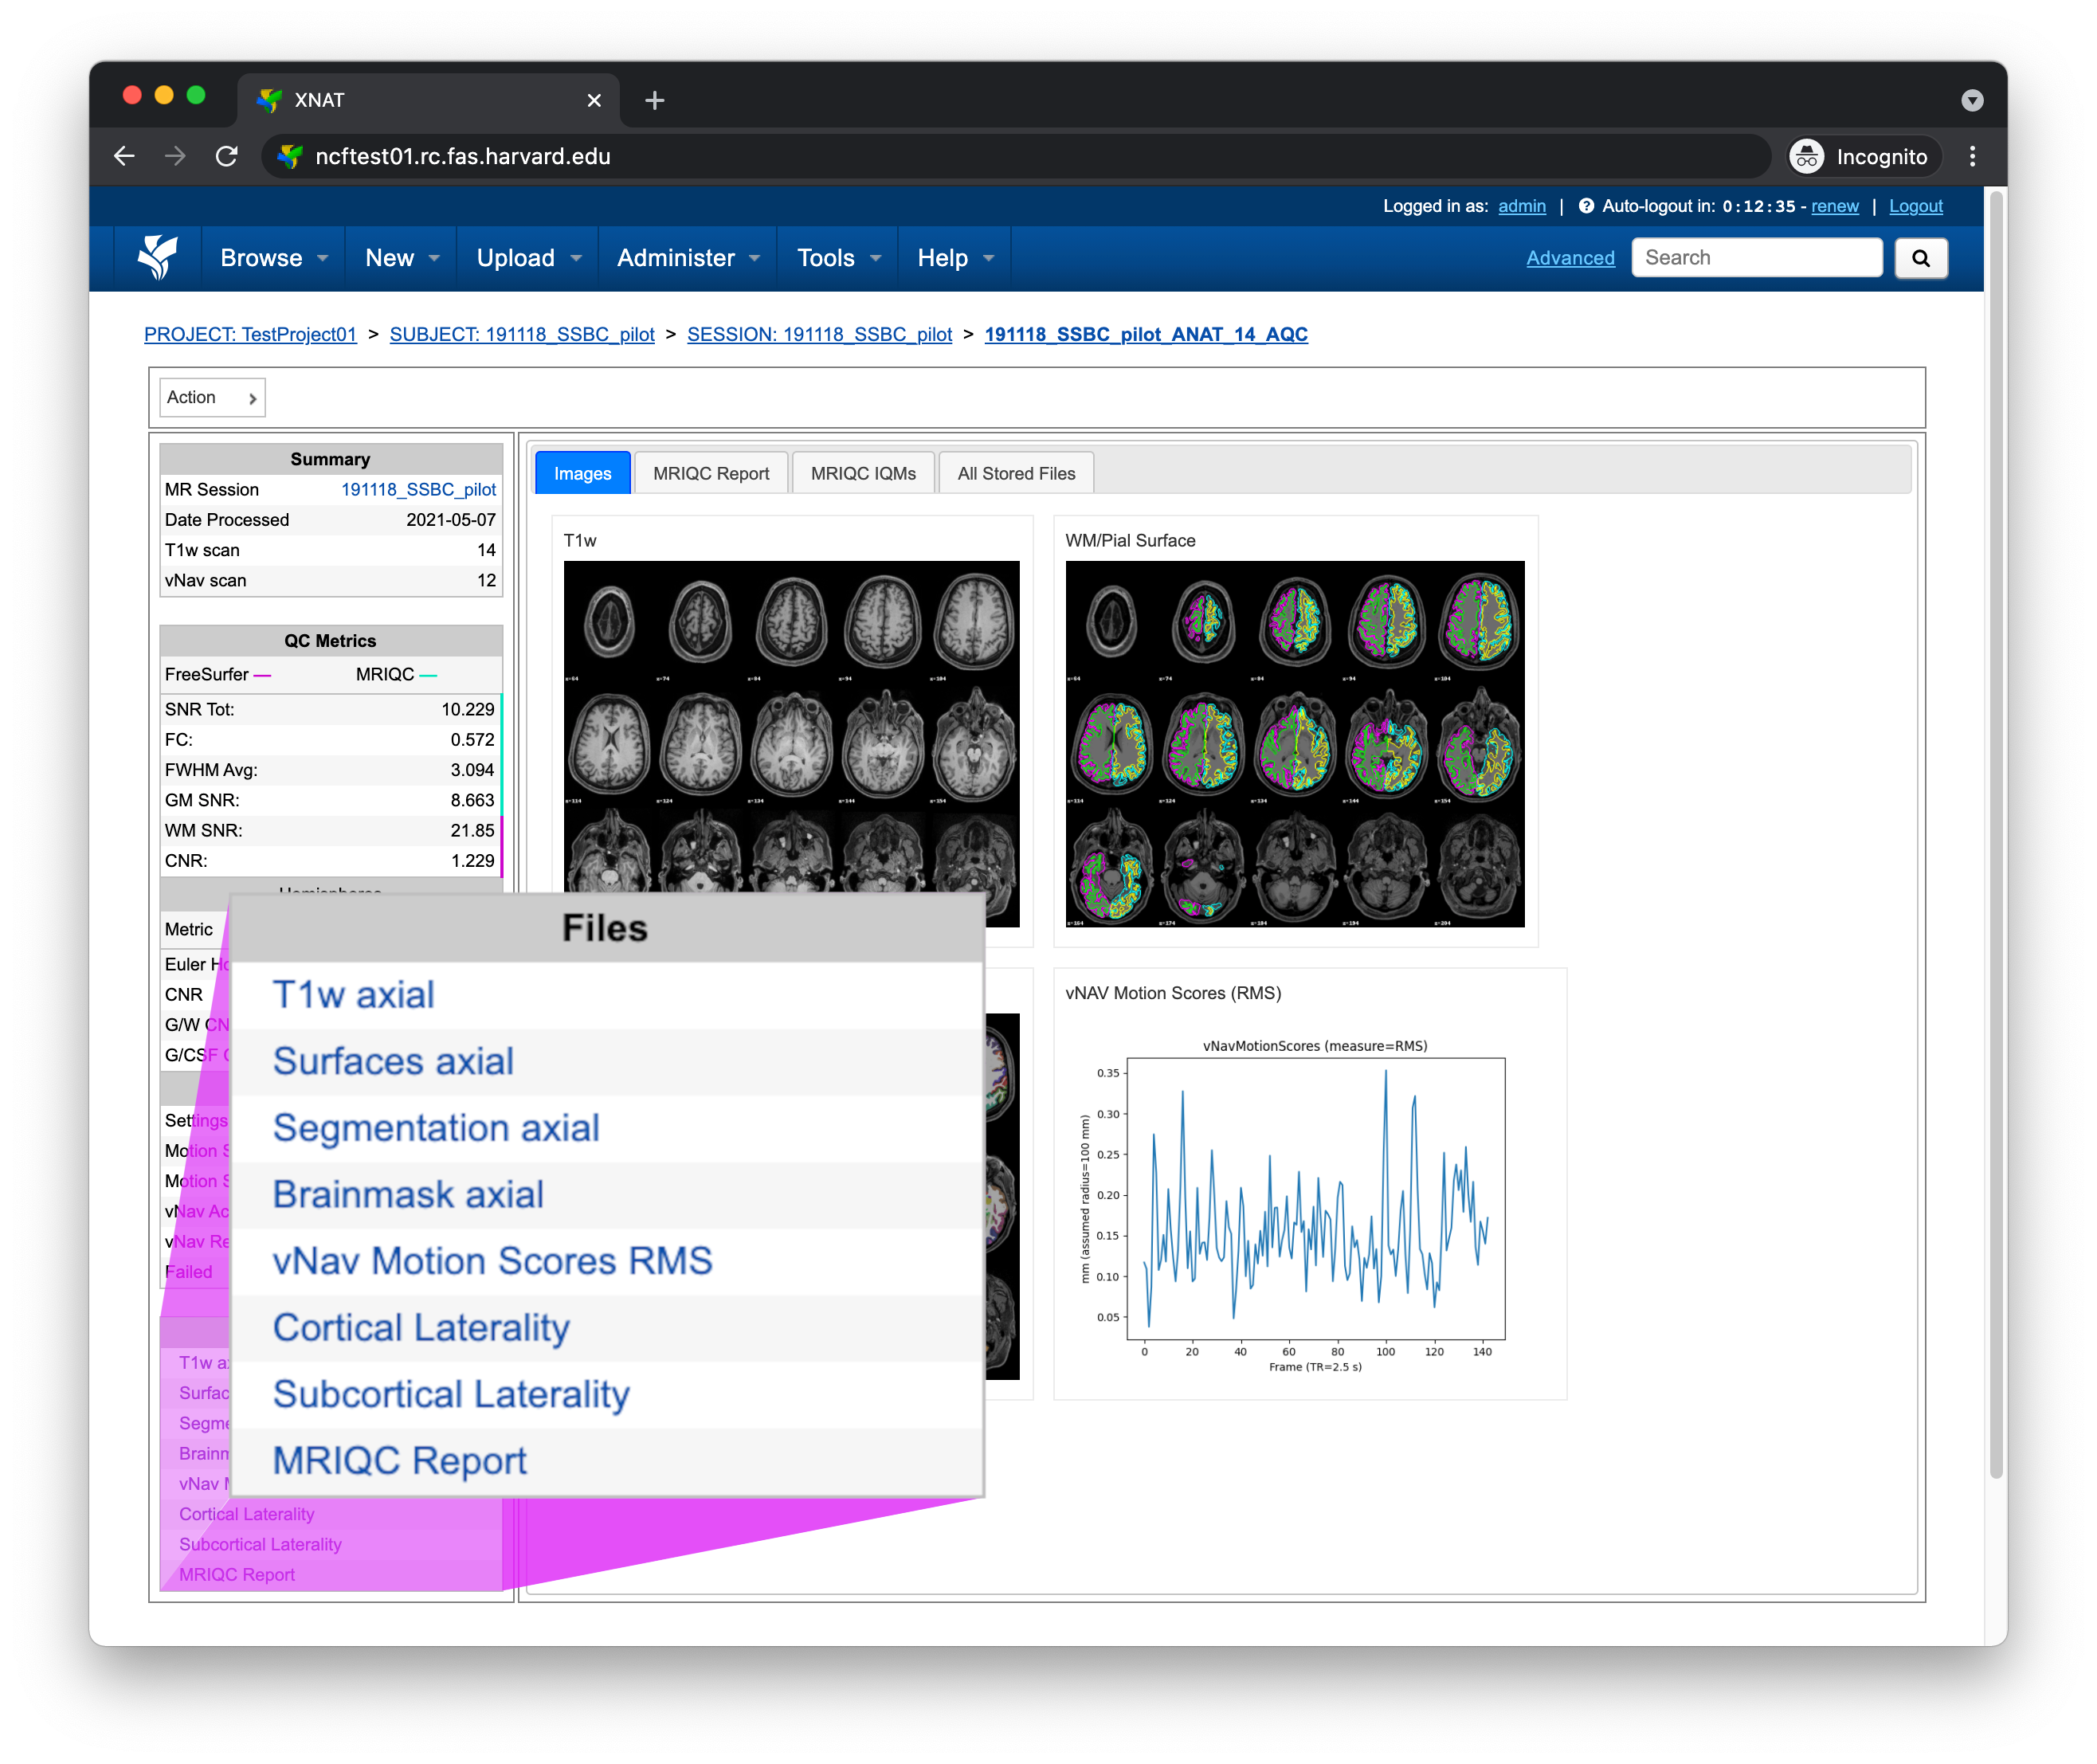
Files
The Files pane contains the most commonly requested files. Clicking on any of these files will display that file in the browser
File |
Description |
|---|---|
T1w axial |
T1-weighted image, axial plane |
Surfaces axial |
FreeSurfer surface boundaries, axial plane |
Segmentation axial |
FreeSurfer segmentations, axial plane |
Brainmask axial |
FreeSurfer brain mask, axial plane |
vNav Motion Scores RMS |
vNav motion scores RMS plot |
Cortical Laterality |
Cortical region volume laterality plot |
Subcortical Laterality |
Subcortical region volume laterality plot |
MRIQC Report |
MRIQC HTML report |
Tabs
To the right of the left pane you’ll find a tab container. The following section explains the contents of each tab.
Images
The Images tab displays a zoomed out view of the T1-weighted image, FreeSurfer surface boundaries, FreeSurfer segmentations, and vNav RMS motion scores
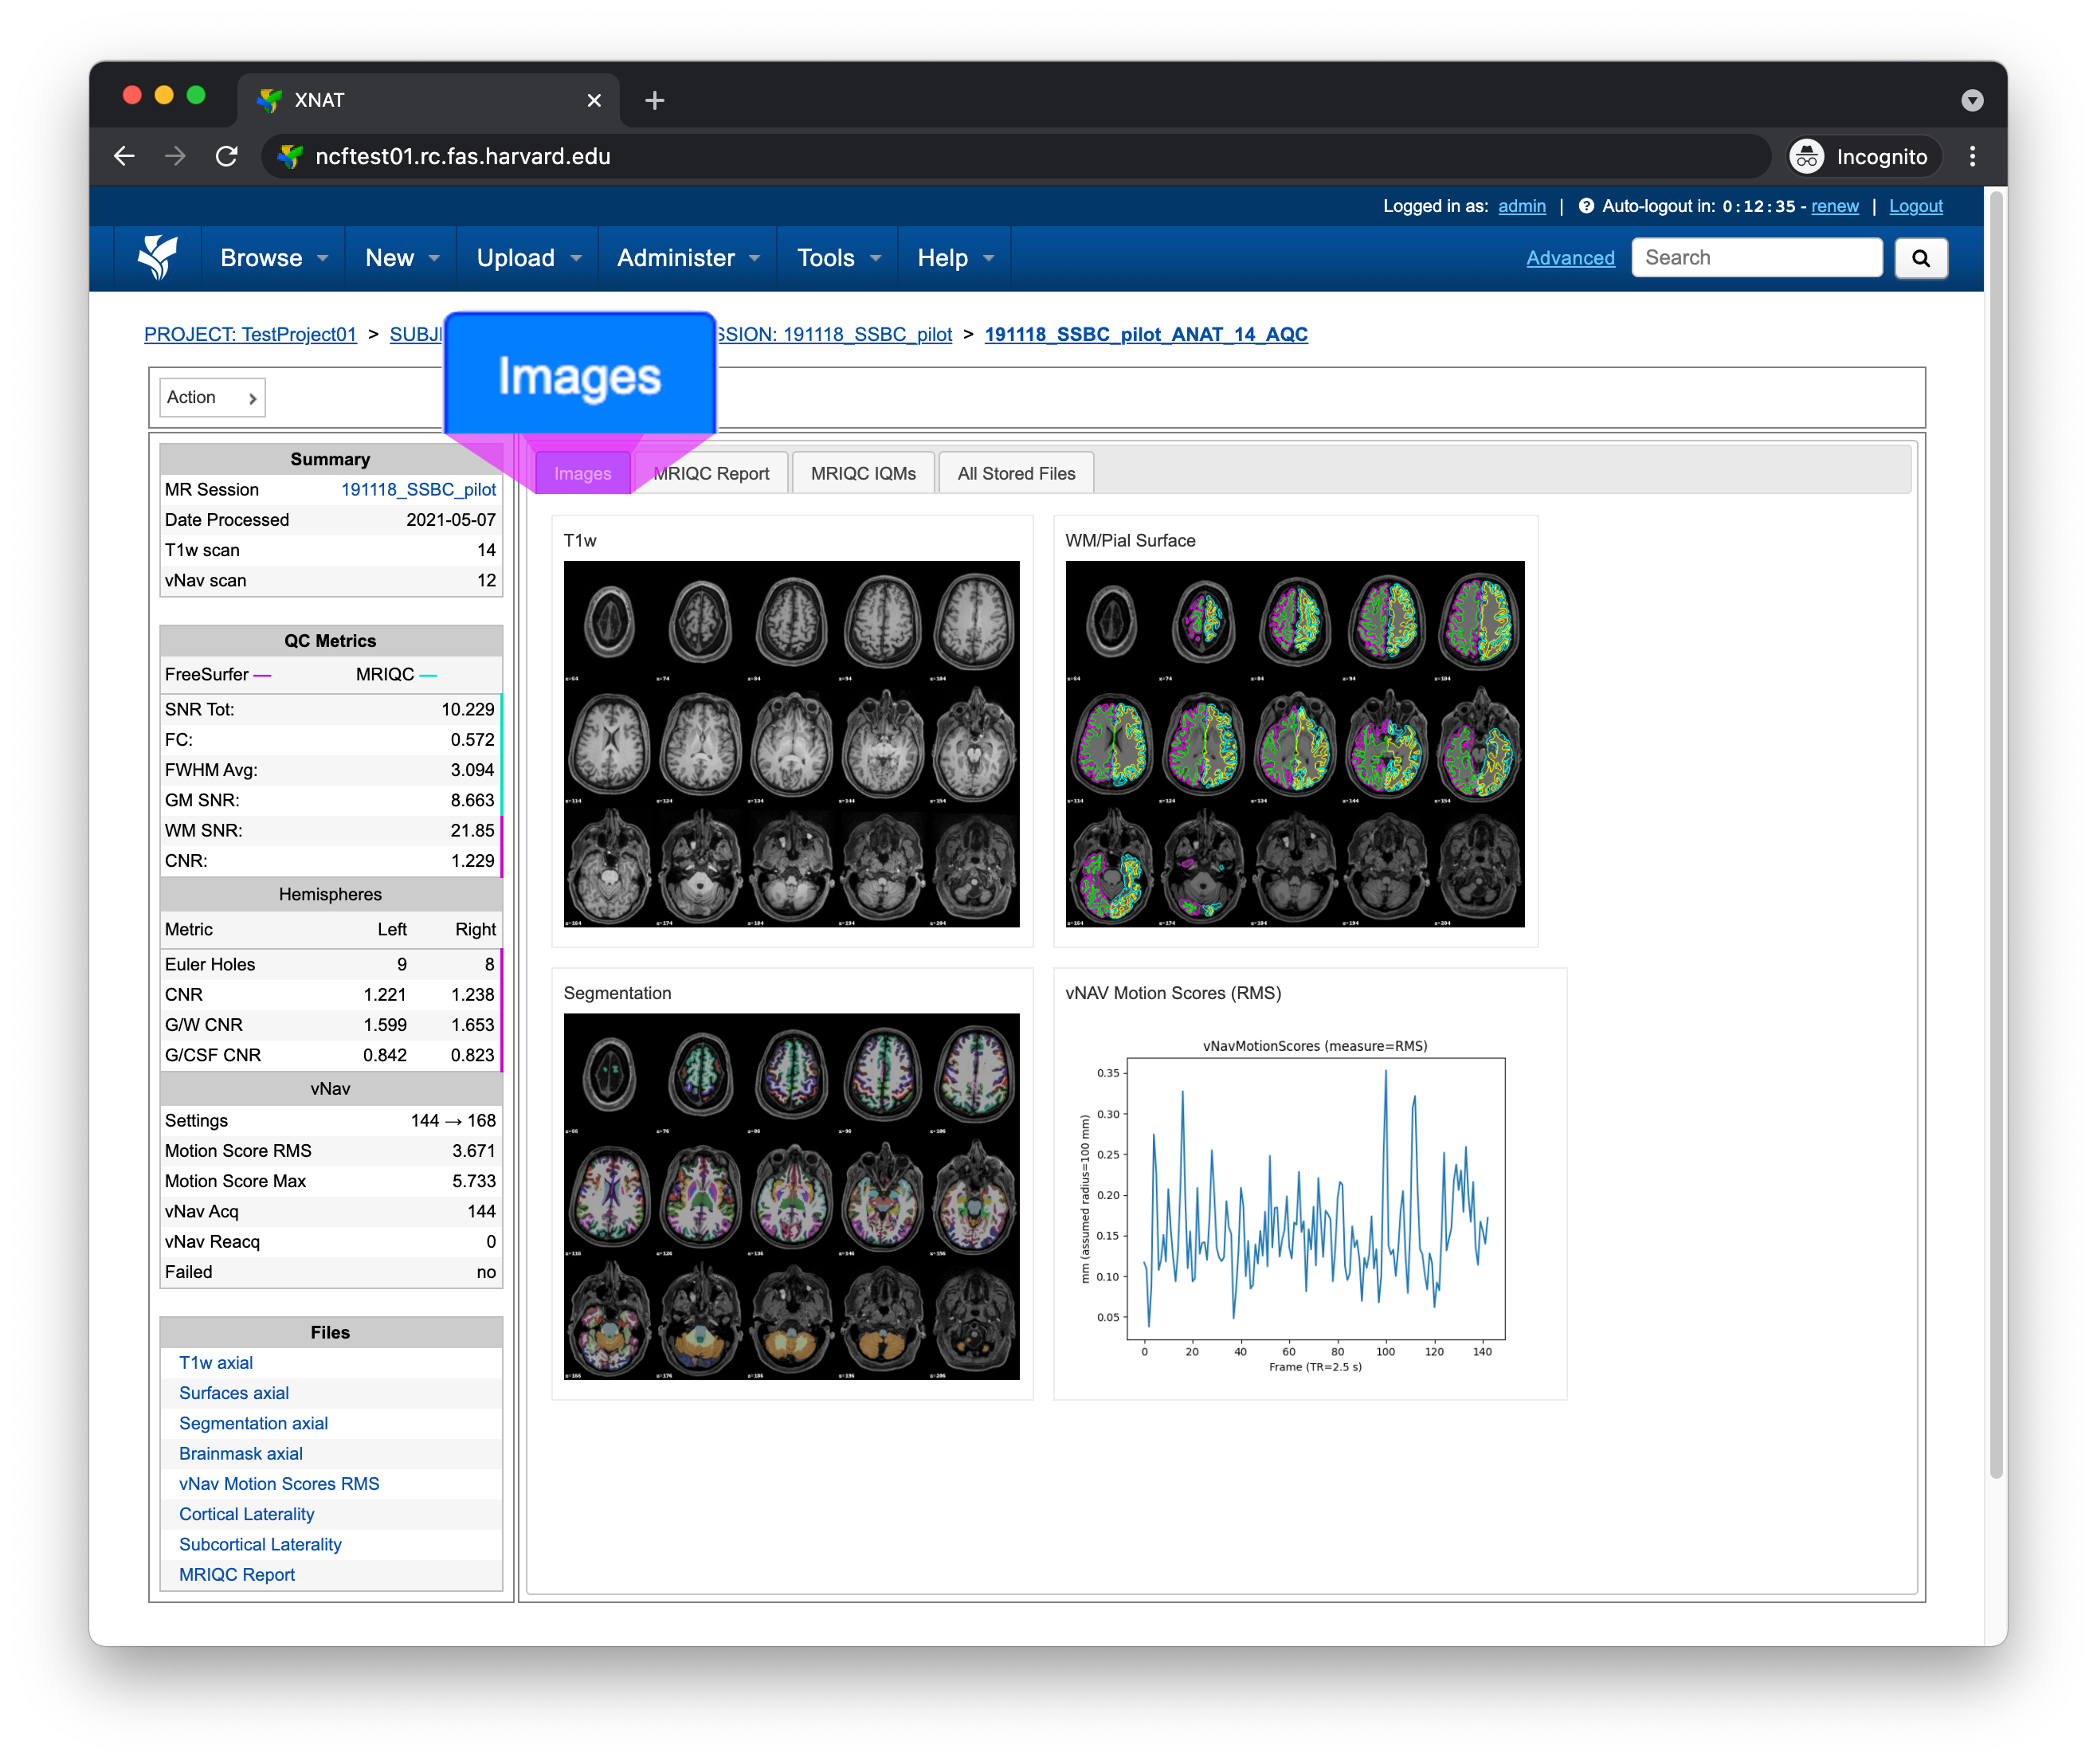
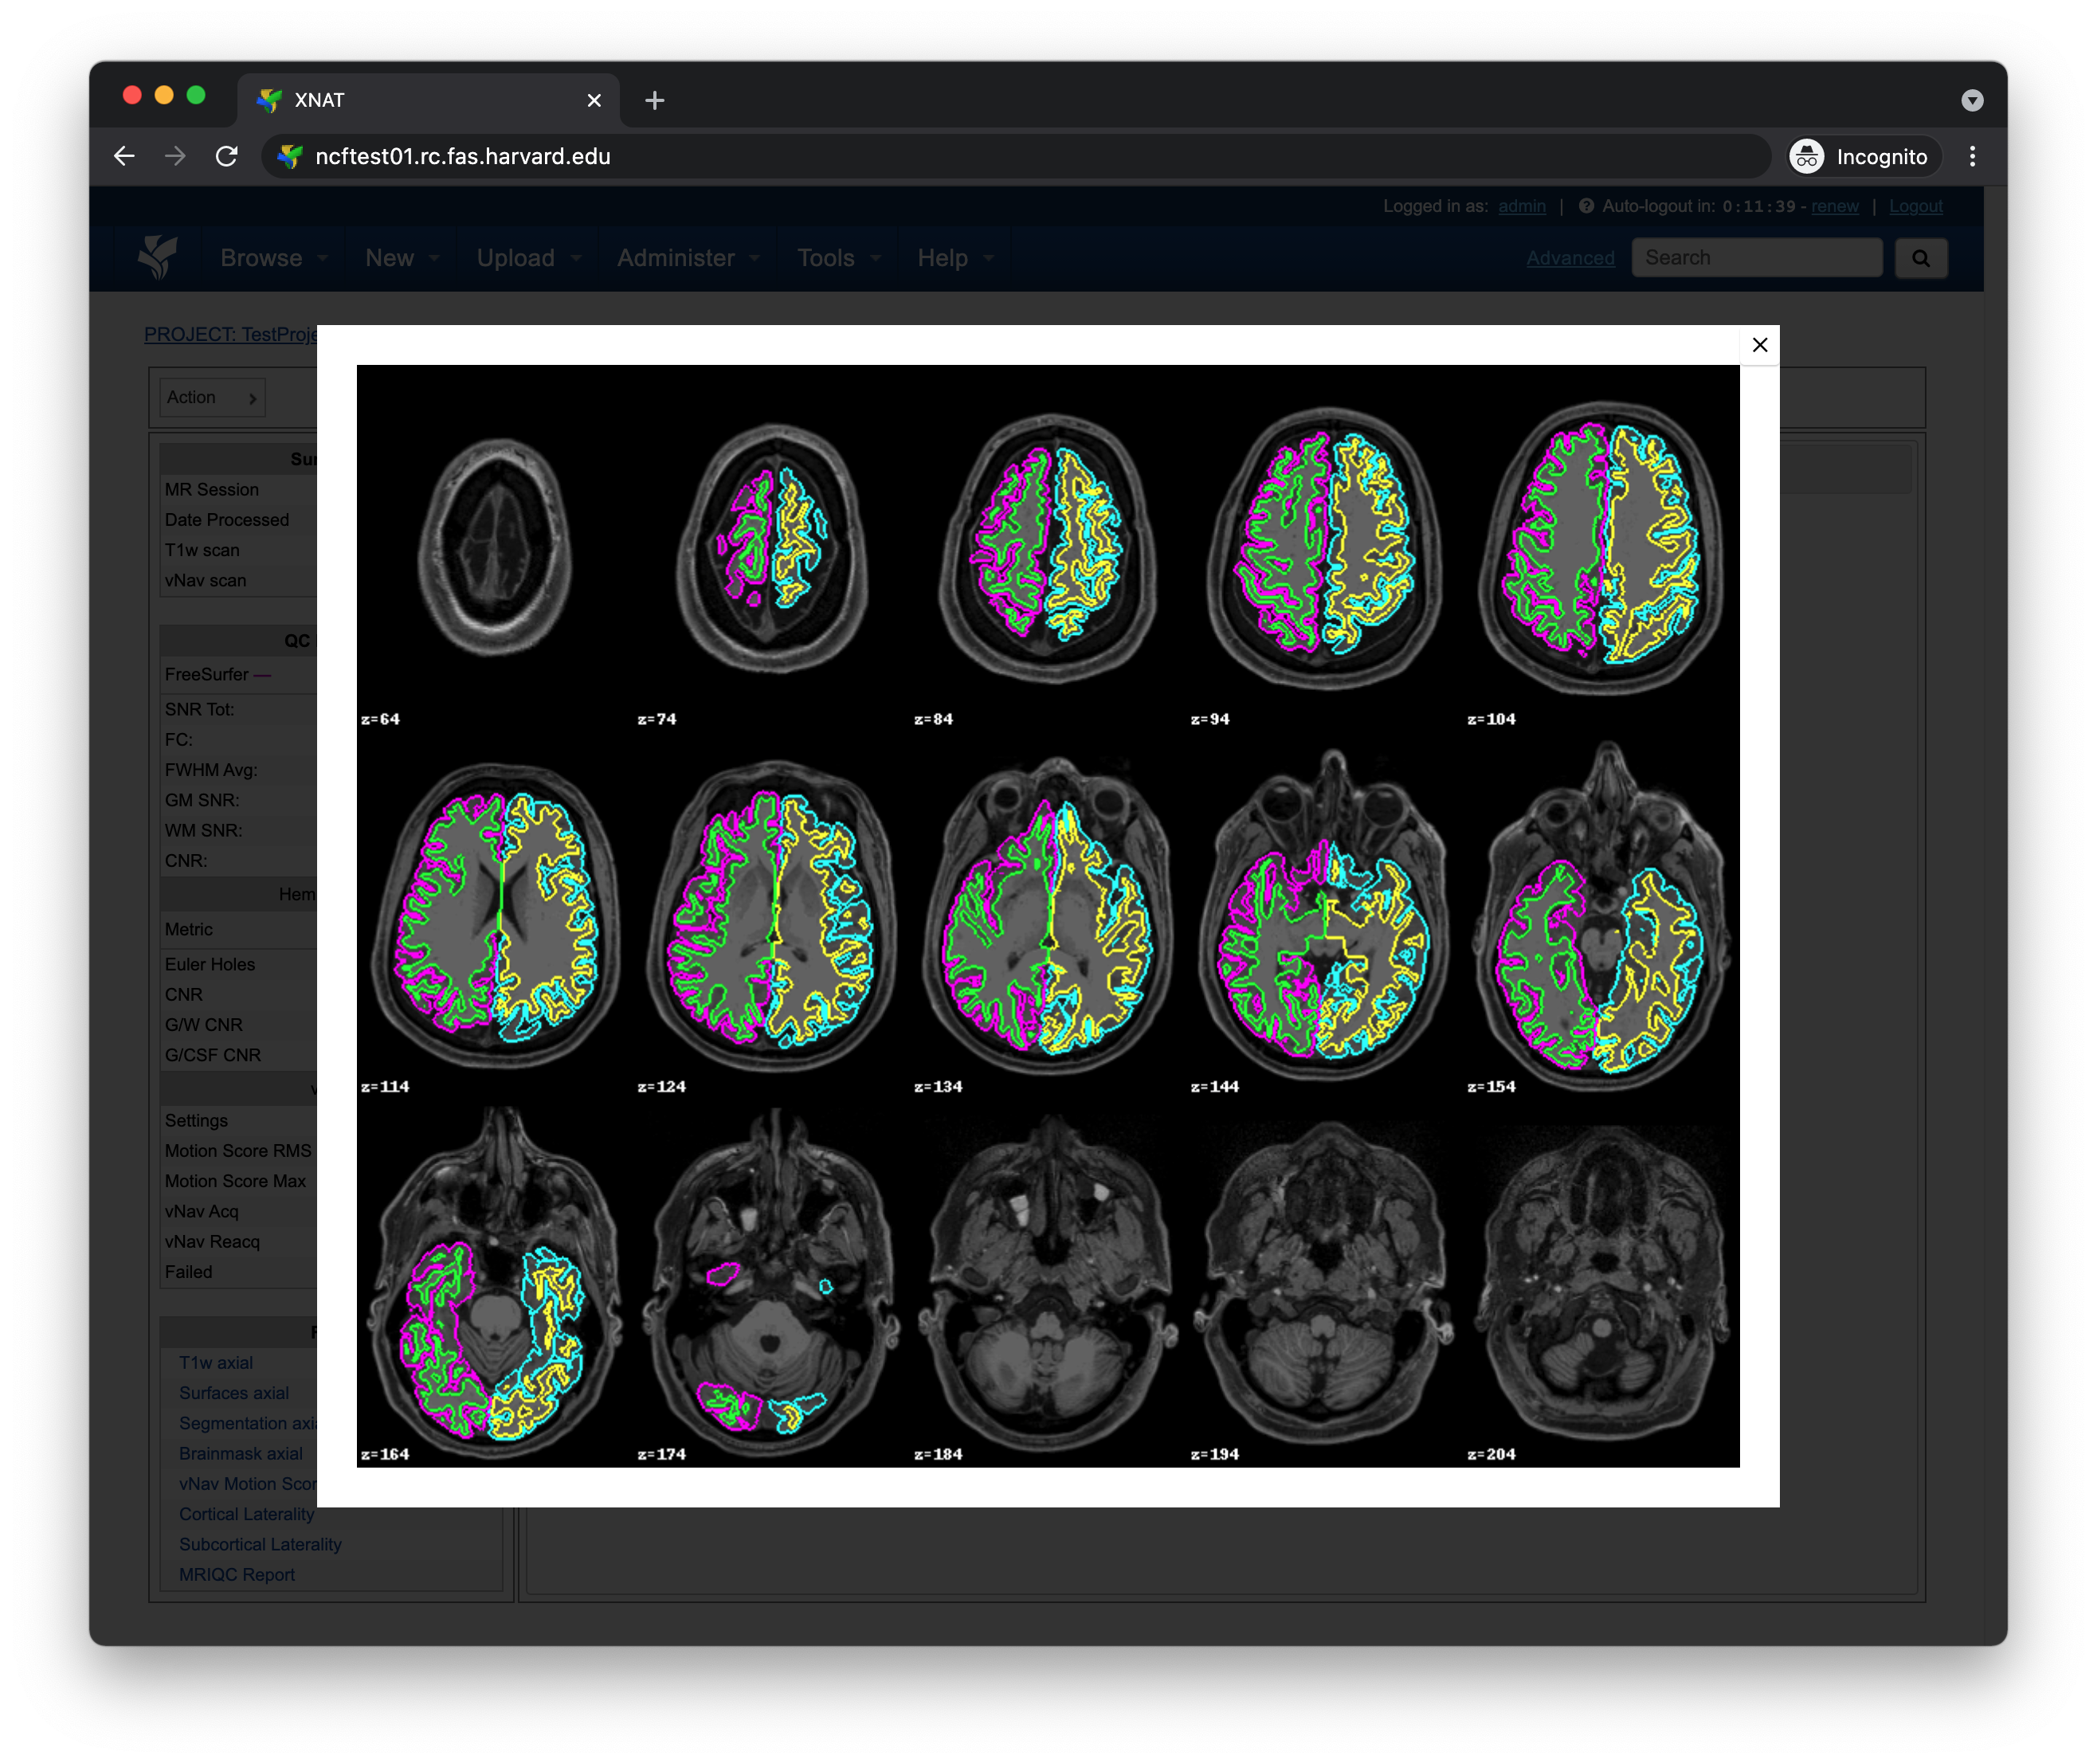
Clicking on an image within the Images tab will display a larger version of that image in the browser
Note
AnatQC automatically crops and centers each brain slice for improved visibility. For this reason, slices will often appear larger than their native size.
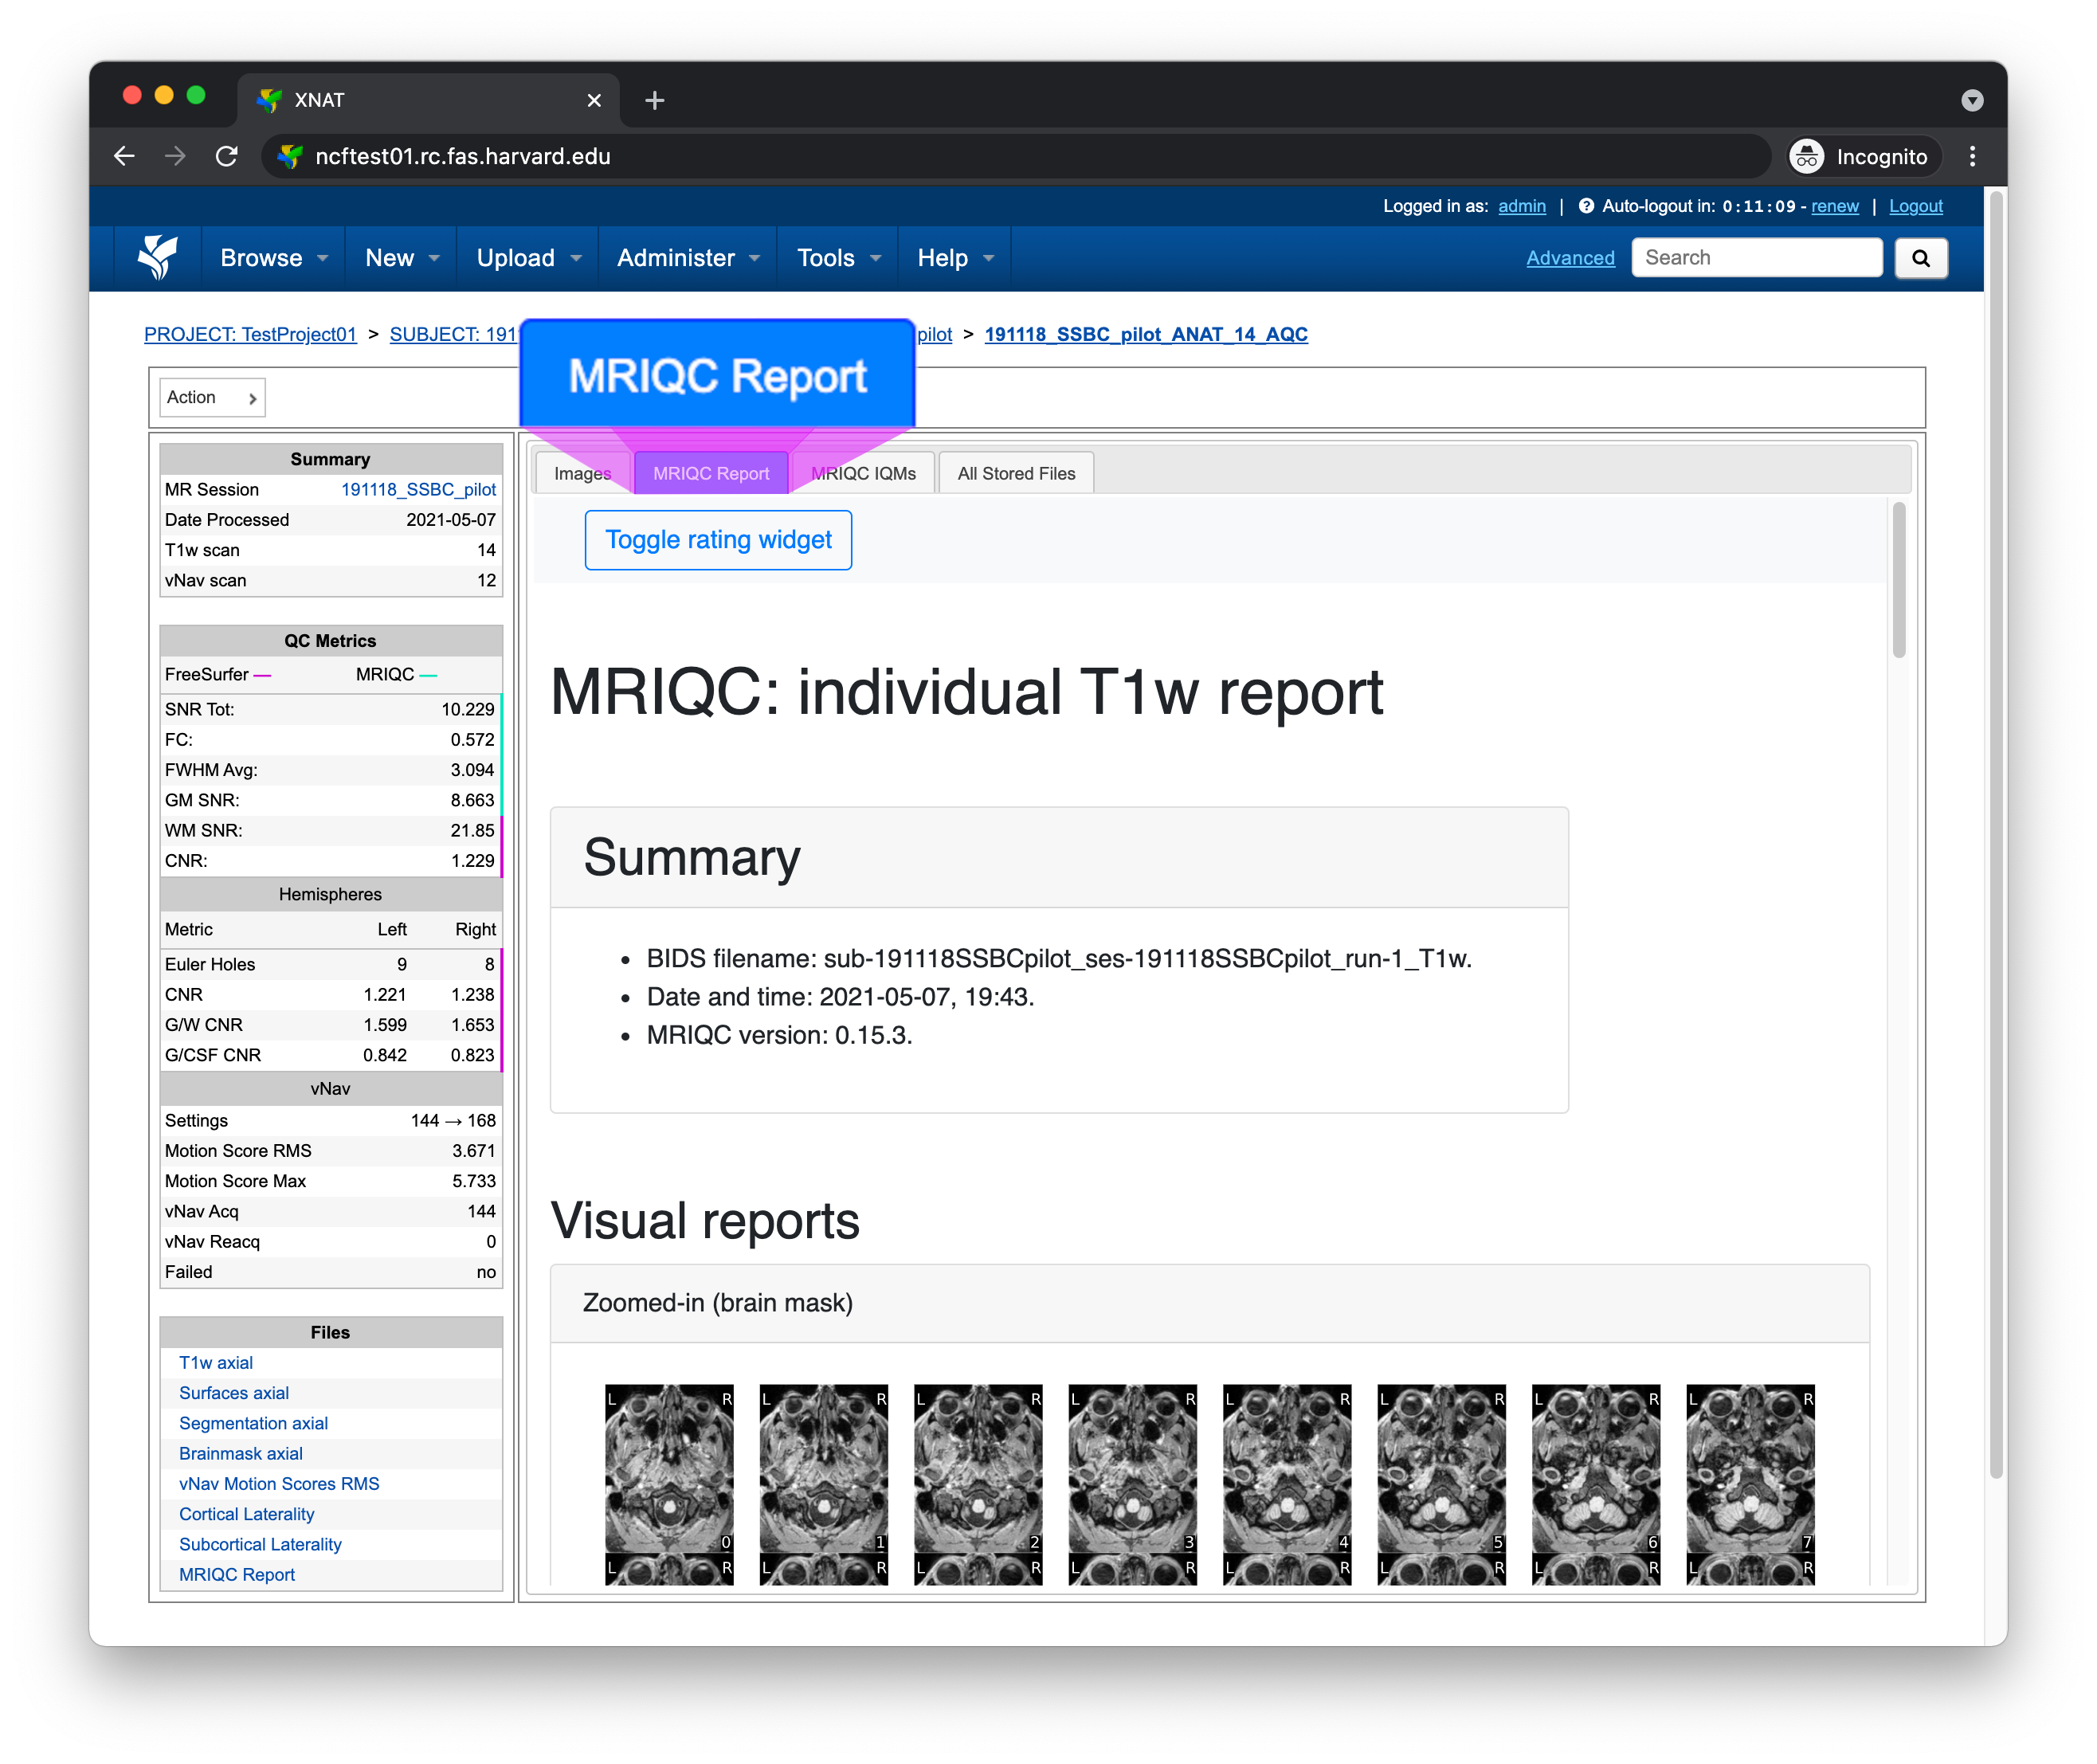
MRIQC Report tab
The MRIQC Report tab displays the complete MRIQC HTML report
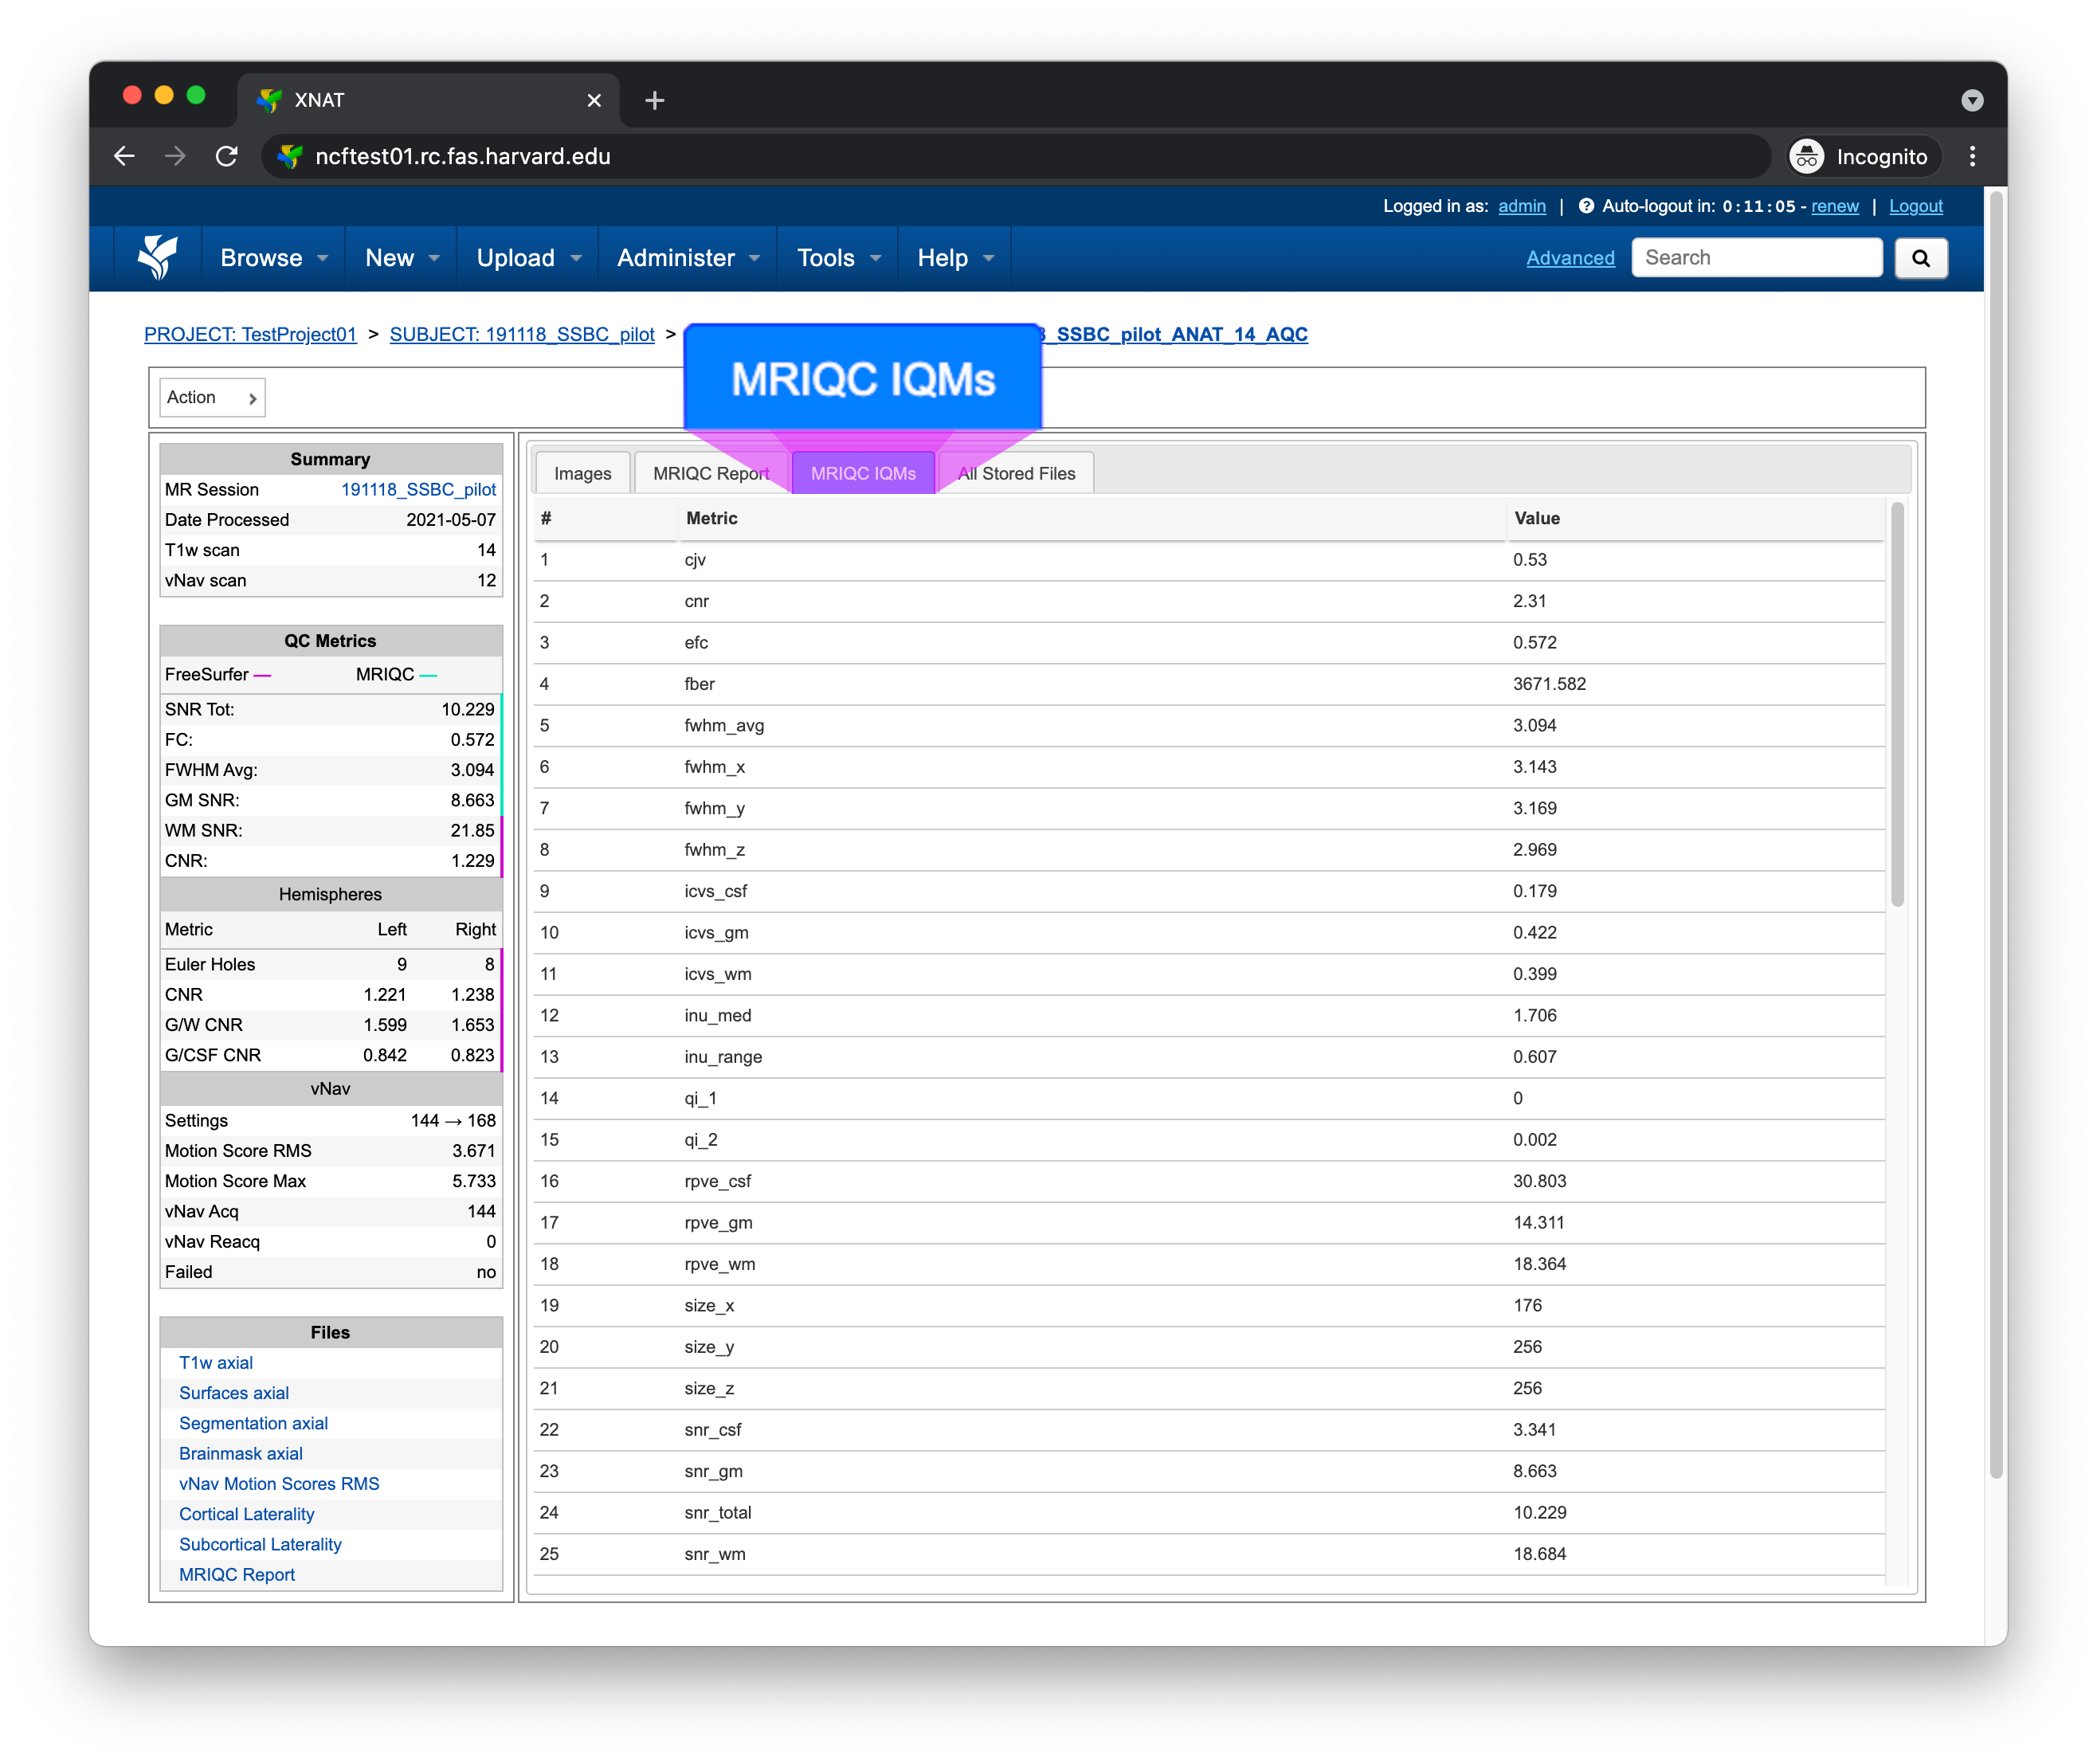
MRIQC IQMs
The MRIQC IQMs tab displays all of the MRIQC Image Quality Metrics.
These metrics can also be found within the MRIQC HTML Report
All Stored Files
The All Stored Files tab contains a list of every file stored by AnatQC
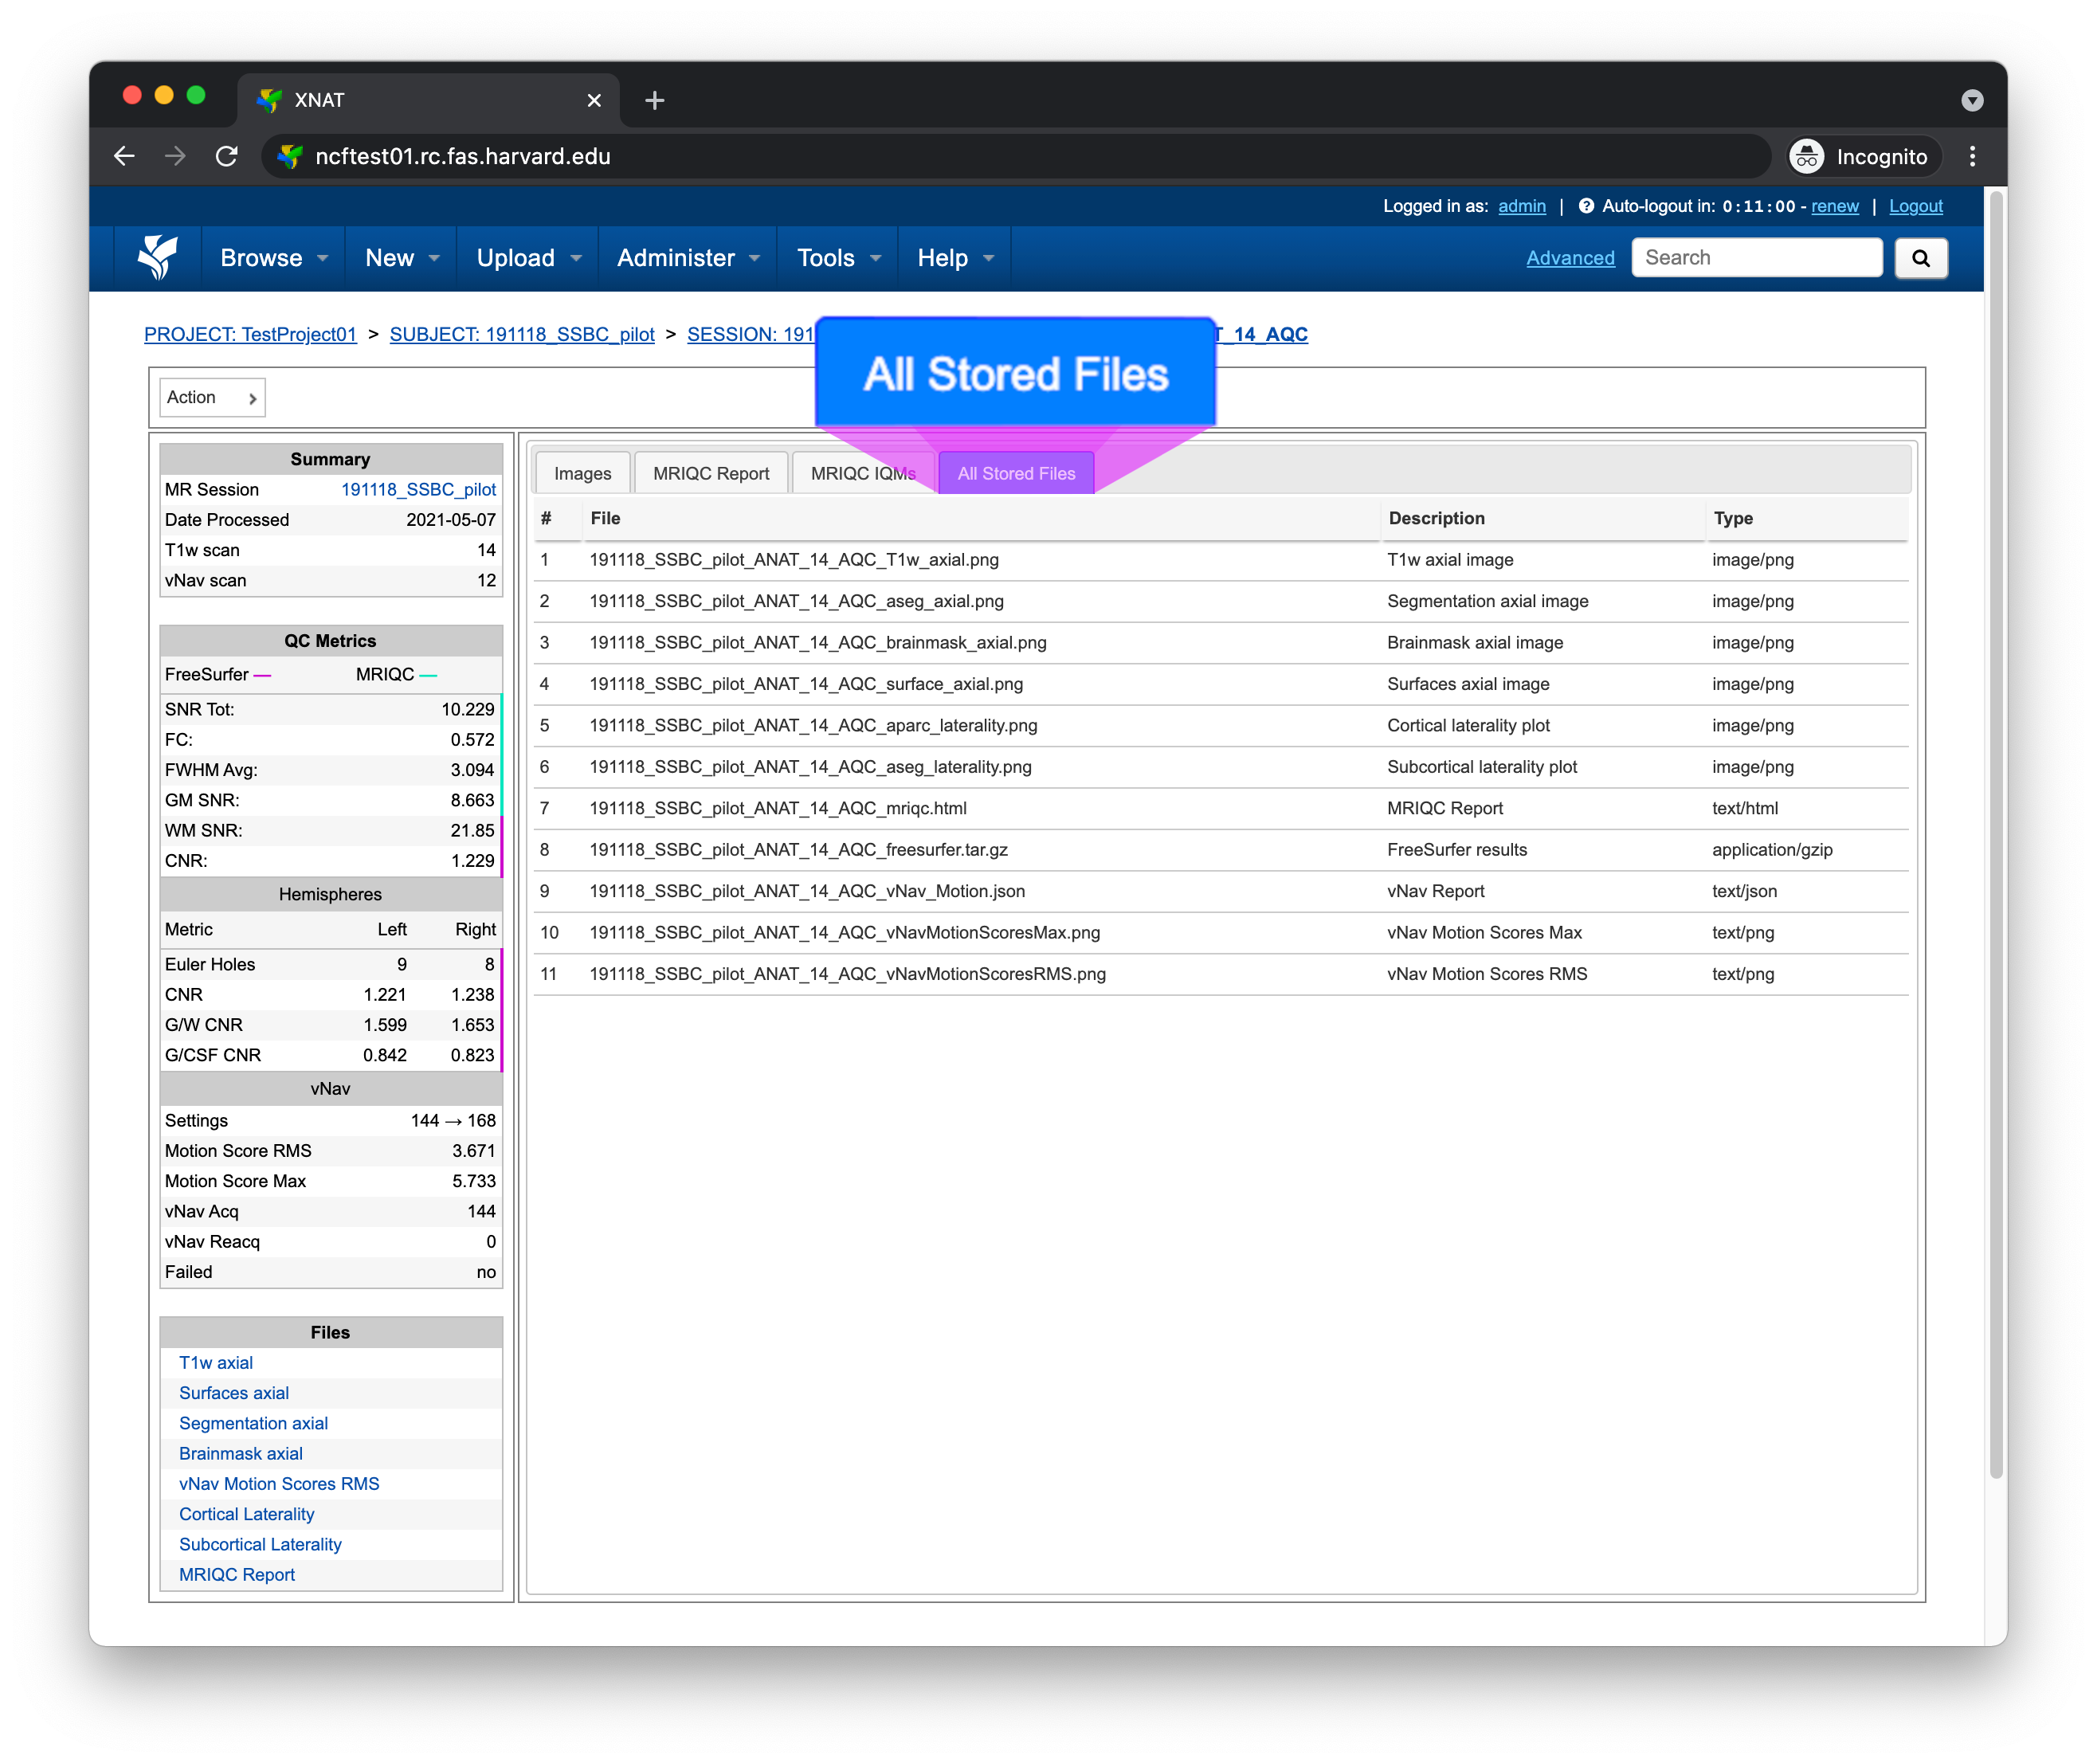
Note
Clicking on a file within the All Stored Files tab will download that file.
File |
Description |
|---|---|
|
T1-weighted image, axial plane |
|
FreeSurfer segmentations, axial plane |
|
FreeSurfer brain mask image, axial plane |
|
FreeSurfer surface boundaries, axial plane |
|
FreeSurfer parcellation laterality plot |
|
FreeSurfer segmentation laterality plot |
|
MRIQC HTML report |
|
FreeSurfer results |
|
vNav processing output |
|
vNav motion max plot |
|
vNav motion RMS plot |